Immigrants from Netherlands vs Navajo Disability Age Over 75
COMPARE
Immigrants from Netherlands
Navajo
Disability Age Over 75
Disability Age Over 75 Comparison
Immigrants from Netherlands
Navajo
45.9%
DISABILITY AGE OVER 75
99.6/ 100
METRIC RATING
56th/ 347
METRIC RANK
58.3%
DISABILITY AGE OVER 75
0.0/ 100
METRIC RATING
344th/ 347
METRIC RANK
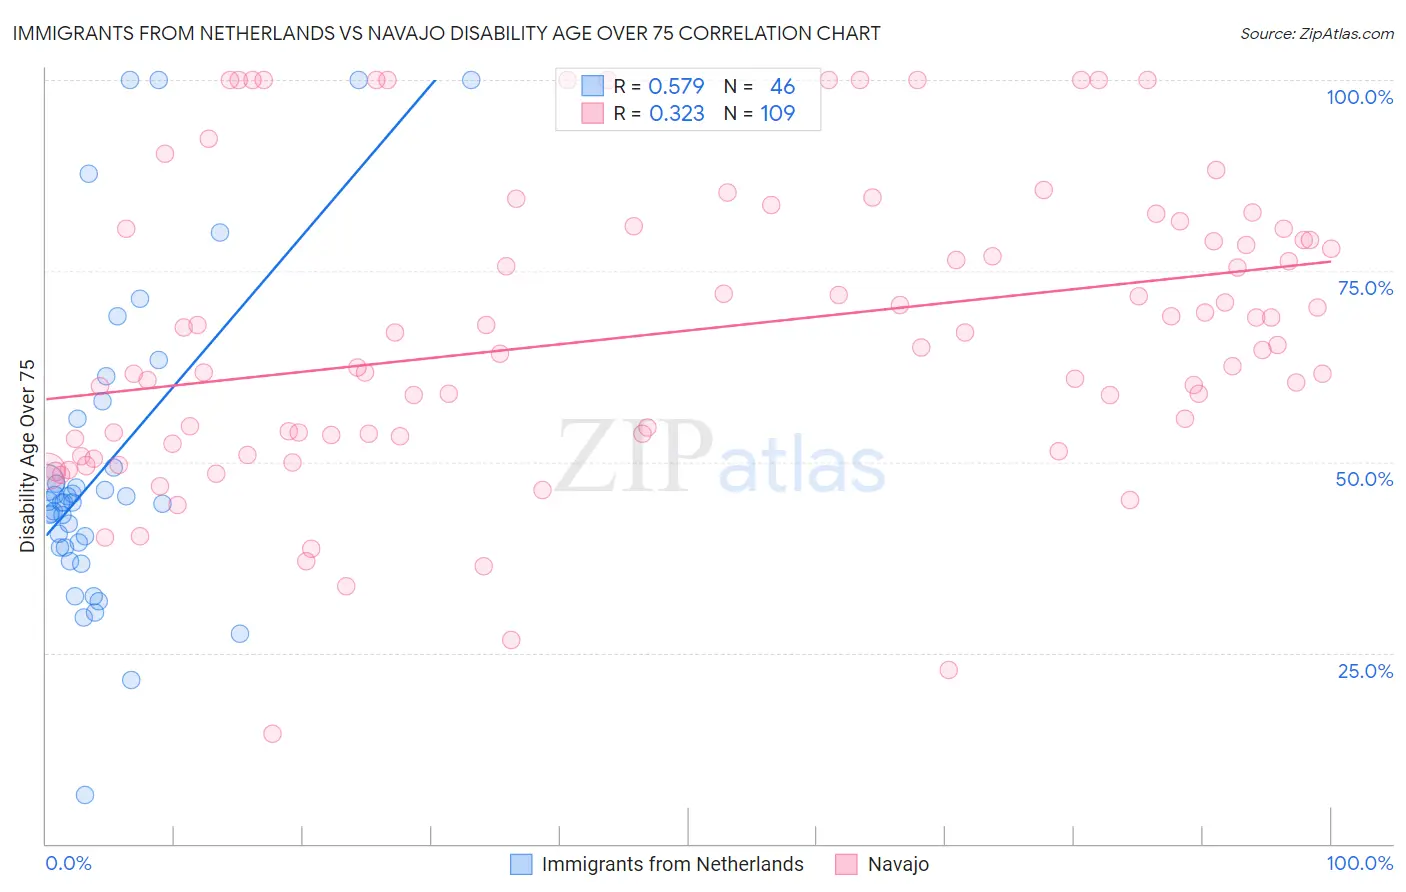
Immigrants from Netherlands vs Navajo Disability Age Over 75 Correlation Chart
The statistical analysis conducted on geographies consisting of 237,734,358 people shows a substantial positive correlation between the proportion of Immigrants from Netherlands and percentage of population with a disability over the age of 75 in the United States with a correlation coefficient (R) of 0.579 and weighted average of 45.9%. Similarly, the statistical analysis conducted on geographies consisting of 224,282,482 people shows a mild positive correlation between the proportion of Navajo and percentage of population with a disability over the age of 75 in the United States with a correlation coefficient (R) of 0.323 and weighted average of 58.3%, a difference of 27.0%.
Disability Age Over 75 Correlation Summary
| Measurement | Immigrants from Netherlands | Navajo |
| Minimum | 6.3% | 14.5% |
| Maximum | 100.0% | 100.0% |
| Range | 93.7% | 85.5% |
| Mean | 49.7% | 66.8% |
| Median | 44.7% | 65.0% |
| Interquartile 25% (IQ1) | 38.9% | 53.2% |
| Interquartile 75% (IQ3) | 55.7% | 80.5% |
| Interquartile Range (IQR) | 16.8% | 27.3% |
| Standard Deviation (Sample) | 21.0% | 19.4% |
| Standard Deviation (Population) | 20.8% | 19.3% |
Similar Demographics by Disability Age Over 75
Demographics Similar to Immigrants from Netherlands by Disability Age Over 75
In terms of disability age over 75, the demographic groups most similar to Immigrants from Netherlands are Immigrants from Turkey (45.9%, a difference of 0.010%), Immigrants from Israel (45.9%, a difference of 0.020%), Iranian (45.9%, a difference of 0.020%), Immigrants from Europe (45.9%, a difference of 0.020%), and Immigrants from Argentina (45.9%, a difference of 0.050%).
| Demographics | Rating | Rank | Disability Age Over 75 |
| Immigrants | North America | 99.8 /100 | #49 | Exceptional 45.7% |
| Belgians | 99.7 /100 | #50 | Exceptional 45.8% |
| Immigrants | Korea | 99.7 /100 | #51 | Exceptional 45.8% |
| Immigrants | France | 99.7 /100 | #52 | Exceptional 45.8% |
| Immigrants | Italy | 99.7 /100 | #53 | Exceptional 45.8% |
| Slovaks | 99.6 /100 | #54 | Exceptional 45.8% |
| Maltese | 99.6 /100 | #55 | Exceptional 45.8% |
| Immigrants | Netherlands | 99.6 /100 | #56 | Exceptional 45.9% |
| Immigrants | Turkey | 99.6 /100 | #57 | Exceptional 45.9% |
| Immigrants | Israel | 99.6 /100 | #58 | Exceptional 45.9% |
| Iranians | 99.6 /100 | #59 | Exceptional 45.9% |
| Immigrants | Europe | 99.6 /100 | #60 | Exceptional 45.9% |
| Immigrants | Argentina | 99.6 /100 | #61 | Exceptional 45.9% |
| Burmese | 99.5 /100 | #62 | Exceptional 45.9% |
| Immigrants | Norway | 99.5 /100 | #63 | Exceptional 45.9% |
Demographics Similar to Navajo by Disability Age Over 75
In terms of disability age over 75, the demographic groups most similar to Navajo are Inupiat (58.4%, a difference of 0.20%), Tsimshian (59.2%, a difference of 1.6%), Tohono O'odham (56.7%, a difference of 2.8%), Lumbee (56.2%, a difference of 3.6%), and Houma (56.2%, a difference of 3.8%).
| Demographics | Rating | Rank | Disability Age Over 75 |
| Apache | 0.0 /100 | #333 | Tragic 53.6% |
| Alaskan Athabascans | 0.0 /100 | #334 | Tragic 54.0% |
| Kiowa | 0.0 /100 | #335 | Tragic 54.2% |
| Immigrants | Armenia | 0.0 /100 | #336 | Tragic 54.3% |
| Yuman | 0.0 /100 | #337 | Tragic 54.4% |
| Colville | 0.0 /100 | #338 | Tragic 55.4% |
| Pima | 0.0 /100 | #339 | Tragic 55.8% |
| Pueblo | 0.0 /100 | #340 | Tragic 55.9% |
| Houma | 0.0 /100 | #341 | Tragic 56.2% |
| Lumbee | 0.0 /100 | #342 | Tragic 56.2% |
| Tohono O'odham | 0.0 /100 | #343 | Tragic 56.7% |
| Navajo | 0.0 /100 | #344 | Tragic 58.3% |
| Inupiat | 0.0 /100 | #345 | Tragic 58.4% |
| Tsimshian | 0.0 /100 | #346 | Tragic 59.2% |
| Yup'ik | 0.0 /100 | #347 | Tragic 61.1% |