Immigrants from Netherlands vs Hmong Disability Age Over 75
COMPARE
Immigrants from Netherlands
Hmong
Disability Age Over 75
Disability Age Over 75 Comparison
Immigrants from Netherlands
Hmong
45.9%
DISABILITY AGE OVER 75
99.6/ 100
METRIC RATING
56th/ 347
METRIC RANK
48.2%
DISABILITY AGE OVER 75
3.8/ 100
METRIC RATING
235th/ 347
METRIC RANK
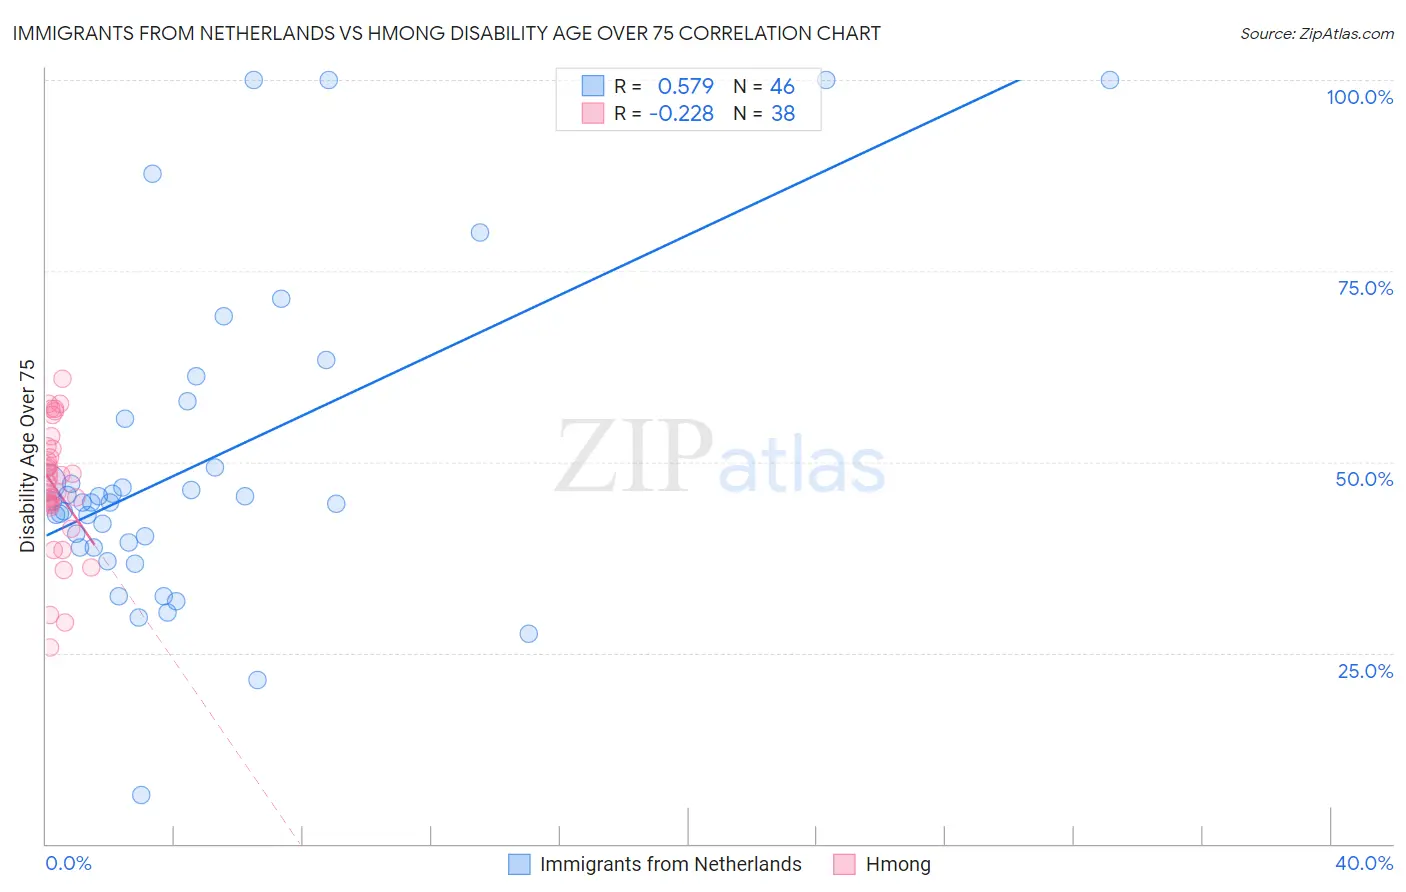
Immigrants from Netherlands vs Hmong Disability Age Over 75 Correlation Chart
The statistical analysis conducted on geographies consisting of 237,734,358 people shows a substantial positive correlation between the proportion of Immigrants from Netherlands and percentage of population with a disability over the age of 75 in the United States with a correlation coefficient (R) of 0.579 and weighted average of 45.9%. Similarly, the statistical analysis conducted on geographies consisting of 24,677,654 people shows a weak negative correlation between the proportion of Hmong and percentage of population with a disability over the age of 75 in the United States with a correlation coefficient (R) of -0.228 and weighted average of 48.2%, a difference of 5.1%.
Disability Age Over 75 Correlation Summary
| Measurement | Immigrants from Netherlands | Hmong |
| Minimum | 6.3% | 25.7% |
| Maximum | 100.0% | 60.8% |
| Range | 93.7% | 35.1% |
| Mean | 49.7% | 46.7% |
| Median | 44.7% | 47.7% |
| Interquartile 25% (IQ1) | 38.9% | 44.4% |
| Interquartile 75% (IQ3) | 55.7% | 51.8% |
| Interquartile Range (IQR) | 16.8% | 7.4% |
| Standard Deviation (Sample) | 21.0% | 8.2% |
| Standard Deviation (Population) | 20.8% | 8.0% |
Similar Demographics by Disability Age Over 75
Demographics Similar to Immigrants from Netherlands by Disability Age Over 75
In terms of disability age over 75, the demographic groups most similar to Immigrants from Netherlands are Immigrants from Turkey (45.9%, a difference of 0.010%), Immigrants from Israel (45.9%, a difference of 0.020%), Iranian (45.9%, a difference of 0.020%), Immigrants from Europe (45.9%, a difference of 0.020%), and Immigrants from Argentina (45.9%, a difference of 0.050%).
| Demographics | Rating | Rank | Disability Age Over 75 |
| Immigrants | North America | 99.8 /100 | #49 | Exceptional 45.7% |
| Belgians | 99.7 /100 | #50 | Exceptional 45.8% |
| Immigrants | Korea | 99.7 /100 | #51 | Exceptional 45.8% |
| Immigrants | France | 99.7 /100 | #52 | Exceptional 45.8% |
| Immigrants | Italy | 99.7 /100 | #53 | Exceptional 45.8% |
| Slovaks | 99.6 /100 | #54 | Exceptional 45.8% |
| Maltese | 99.6 /100 | #55 | Exceptional 45.8% |
| Immigrants | Netherlands | 99.6 /100 | #56 | Exceptional 45.9% |
| Immigrants | Turkey | 99.6 /100 | #57 | Exceptional 45.9% |
| Immigrants | Israel | 99.6 /100 | #58 | Exceptional 45.9% |
| Iranians | 99.6 /100 | #59 | Exceptional 45.9% |
| Immigrants | Europe | 99.6 /100 | #60 | Exceptional 45.9% |
| Immigrants | Argentina | 99.6 /100 | #61 | Exceptional 45.9% |
| Burmese | 99.5 /100 | #62 | Exceptional 45.9% |
| Immigrants | Norway | 99.5 /100 | #63 | Exceptional 45.9% |
Demographics Similar to Hmong by Disability Age Over 75
In terms of disability age over 75, the demographic groups most similar to Hmong are Subsaharan African (48.2%, a difference of 0.0%), Indonesian (48.2%, a difference of 0.070%), Cree (48.2%, a difference of 0.070%), Immigrants (48.2%, a difference of 0.080%), and Taiwanese (48.2%, a difference of 0.090%).
| Demographics | Rating | Rank | Disability Age Over 75 |
| Immigrants | Liberia | 5.9 /100 | #228 | Tragic 48.1% |
| Spaniards | 5.7 /100 | #229 | Tragic 48.1% |
| Taiwanese | 4.4 /100 | #230 | Tragic 48.2% |
| Immigrants | Immigrants | 4.3 /100 | #231 | Tragic 48.2% |
| Indonesians | 4.2 /100 | #232 | Tragic 48.2% |
| Cree | 4.2 /100 | #233 | Tragic 48.2% |
| Sub-Saharan Africans | 3.8 /100 | #234 | Tragic 48.2% |
| Hmong | 3.8 /100 | #235 | Tragic 48.2% |
| Immigrants | Nicaragua | 3.2 /100 | #236 | Tragic 48.2% |
| Immigrants | St. Vincent and the Grenadines | 3.2 /100 | #237 | Tragic 48.2% |
| Nicaraguans | 3.0 /100 | #238 | Tragic 48.3% |
| Immigrants | Thailand | 2.8 /100 | #239 | Tragic 48.3% |
| Tongans | 2.3 /100 | #240 | Tragic 48.3% |
| Native Hawaiians | 2.2 /100 | #241 | Tragic 48.3% |
| French American Indians | 2.2 /100 | #242 | Tragic 48.3% |