Immigrants from South America vs Navajo Disability Age Over 75
COMPARE
Immigrants from South America
Navajo
Disability Age Over 75
Disability Age Over 75 Comparison
Immigrants from South America
Navajo
46.7%
DISABILITY AGE OVER 75
91.8/ 100
METRIC RATING
124th/ 347
METRIC RANK
58.3%
DISABILITY AGE OVER 75
0.0/ 100
METRIC RATING
344th/ 347
METRIC RANK
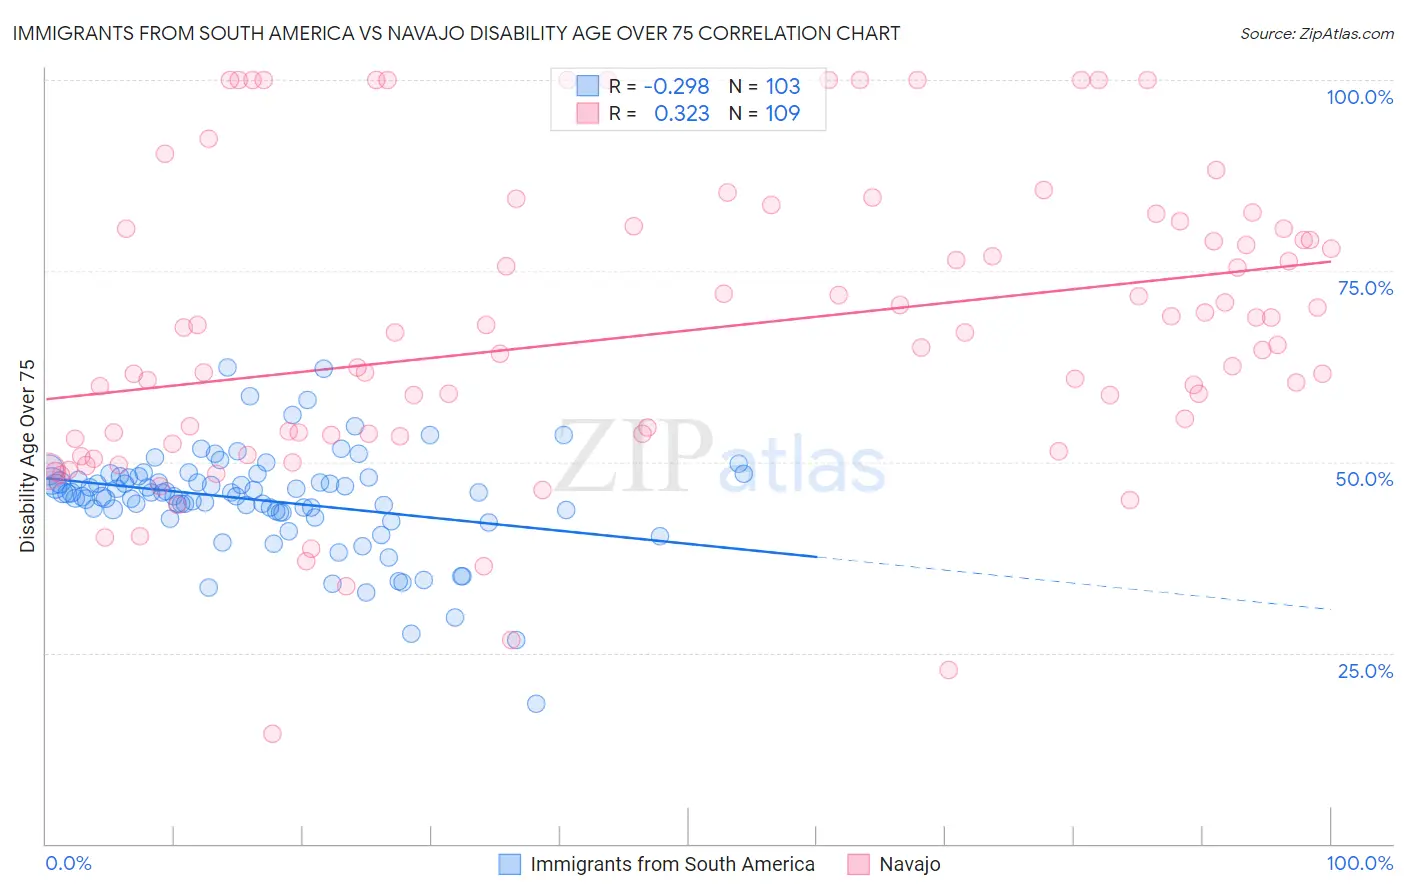
Immigrants from South America vs Navajo Disability Age Over 75 Correlation Chart
The statistical analysis conducted on geographies consisting of 485,170,882 people shows a weak negative correlation between the proportion of Immigrants from South America and percentage of population with a disability over the age of 75 in the United States with a correlation coefficient (R) of -0.298 and weighted average of 46.7%. Similarly, the statistical analysis conducted on geographies consisting of 224,282,482 people shows a mild positive correlation between the proportion of Navajo and percentage of population with a disability over the age of 75 in the United States with a correlation coefficient (R) of 0.323 and weighted average of 58.3%, a difference of 24.8%.
Disability Age Over 75 Correlation Summary
| Measurement | Immigrants from South America | Navajo |
| Minimum | 18.4% | 14.5% |
| Maximum | 62.4% | 100.0% |
| Range | 44.0% | 85.5% |
| Mean | 45.0% | 66.8% |
| Median | 45.9% | 65.0% |
| Interquartile 25% (IQ1) | 43.4% | 53.2% |
| Interquartile 75% (IQ3) | 48.0% | 80.5% |
| Interquartile Range (IQR) | 4.6% | 27.3% |
| Standard Deviation (Sample) | 6.8% | 19.4% |
| Standard Deviation (Population) | 6.7% | 19.3% |
Similar Demographics by Disability Age Over 75
Demographics Similar to Immigrants from South America by Disability Age Over 75
In terms of disability age over 75, the demographic groups most similar to Immigrants from South America are Colombian (46.7%, a difference of 0.030%), European (46.7%, a difference of 0.040%), Syrian (46.7%, a difference of 0.050%), Immigrants from Colombia (46.7%, a difference of 0.060%), and Icelander (46.7%, a difference of 0.060%).
| Demographics | Rating | Rank | Disability Age Over 75 |
| Hungarians | 95.3 /100 | #117 | Exceptional 46.5% |
| Czechoslovakians | 94.7 /100 | #118 | Exceptional 46.6% |
| Canadians | 94.4 /100 | #119 | Exceptional 46.6% |
| Immigrants | Nepal | 94.1 /100 | #120 | Exceptional 46.6% |
| Scandinavians | 93.6 /100 | #121 | Exceptional 46.6% |
| Immigrants | Albania | 93.2 /100 | #122 | Exceptional 46.6% |
| Immigrants | Colombia | 92.6 /100 | #123 | Exceptional 46.7% |
| Immigrants | South America | 91.8 /100 | #124 | Exceptional 46.7% |
| Colombians | 91.3 /100 | #125 | Exceptional 46.7% |
| Europeans | 91.2 /100 | #126 | Exceptional 46.7% |
| Syrians | 91.1 /100 | #127 | Exceptional 46.7% |
| Icelanders | 90.9 /100 | #128 | Exceptional 46.7% |
| Immigrants | Germany | 90.8 /100 | #129 | Exceptional 46.7% |
| Immigrants | Northern Africa | 90.7 /100 | #130 | Exceptional 46.7% |
| Scottish | 90.5 /100 | #131 | Exceptional 46.7% |
Demographics Similar to Navajo by Disability Age Over 75
In terms of disability age over 75, the demographic groups most similar to Navajo are Inupiat (58.4%, a difference of 0.20%), Tsimshian (59.2%, a difference of 1.6%), Tohono O'odham (56.7%, a difference of 2.8%), Lumbee (56.2%, a difference of 3.6%), and Houma (56.2%, a difference of 3.8%).
| Demographics | Rating | Rank | Disability Age Over 75 |
| Apache | 0.0 /100 | #333 | Tragic 53.6% |
| Alaskan Athabascans | 0.0 /100 | #334 | Tragic 54.0% |
| Kiowa | 0.0 /100 | #335 | Tragic 54.2% |
| Immigrants | Armenia | 0.0 /100 | #336 | Tragic 54.3% |
| Yuman | 0.0 /100 | #337 | Tragic 54.4% |
| Colville | 0.0 /100 | #338 | Tragic 55.4% |
| Pima | 0.0 /100 | #339 | Tragic 55.8% |
| Pueblo | 0.0 /100 | #340 | Tragic 55.9% |
| Houma | 0.0 /100 | #341 | Tragic 56.2% |
| Lumbee | 0.0 /100 | #342 | Tragic 56.2% |
| Tohono O'odham | 0.0 /100 | #343 | Tragic 56.7% |
| Navajo | 0.0 /100 | #344 | Tragic 58.3% |
| Inupiat | 0.0 /100 | #345 | Tragic 58.4% |
| Tsimshian | 0.0 /100 | #346 | Tragic 59.2% |
| Yup'ik | 0.0 /100 | #347 | Tragic 61.1% |