Paraguayan vs Navajo Disability Age Over 75
COMPARE
Paraguayan
Navajo
Disability Age Over 75
Disability Age Over 75 Comparison
Paraguayans
Navajo
45.0%
DISABILITY AGE OVER 75
100.0/ 100
METRIC RATING
9th/ 347
METRIC RANK
58.3%
DISABILITY AGE OVER 75
0.0/ 100
METRIC RATING
344th/ 347
METRIC RANK
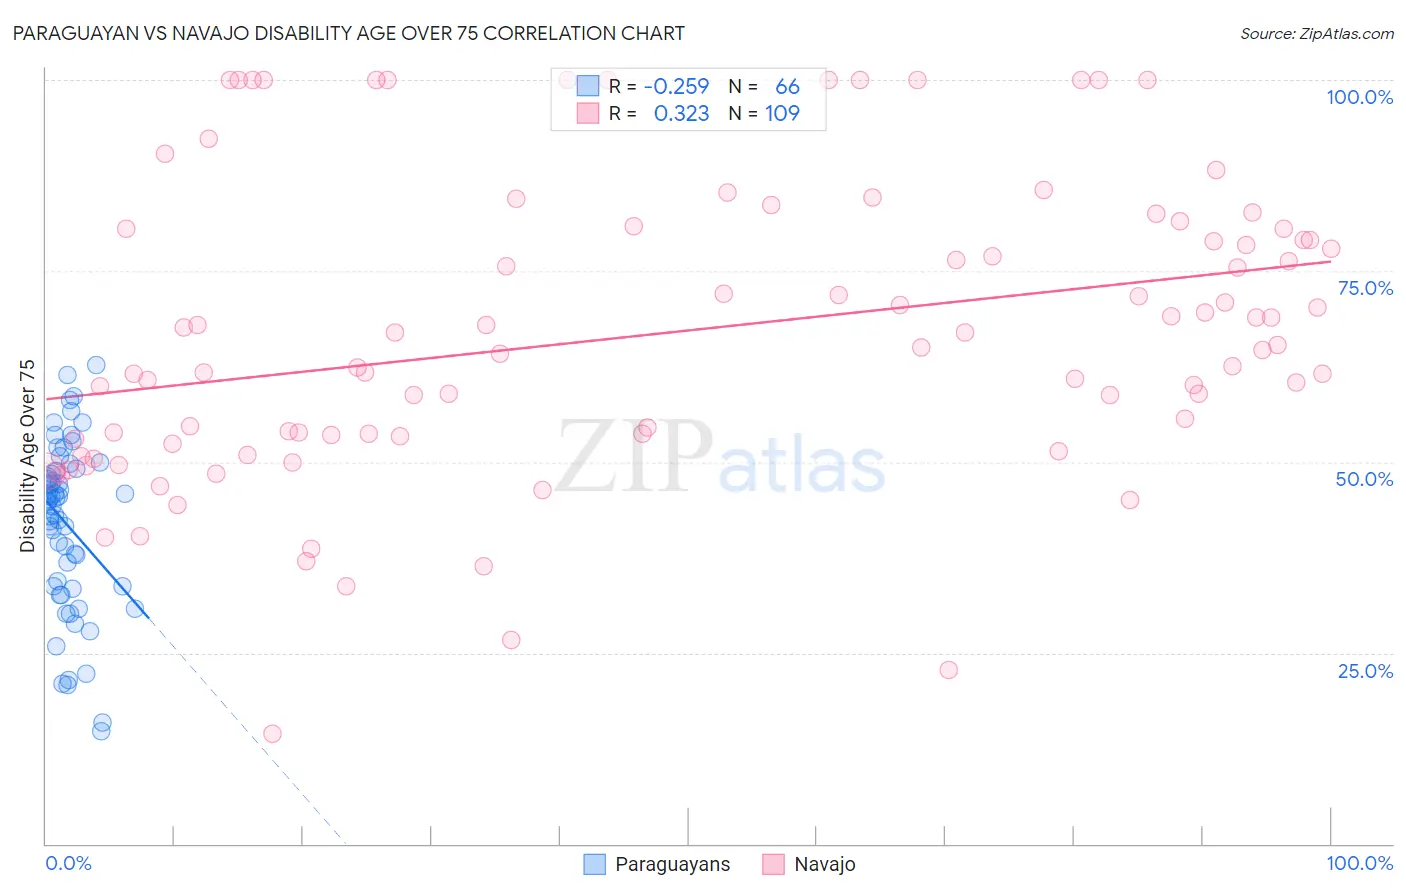
Paraguayan vs Navajo Disability Age Over 75 Correlation Chart
The statistical analysis conducted on geographies consisting of 95,066,905 people shows a weak negative correlation between the proportion of Paraguayans and percentage of population with a disability over the age of 75 in the United States with a correlation coefficient (R) of -0.259 and weighted average of 45.0%. Similarly, the statistical analysis conducted on geographies consisting of 224,282,482 people shows a mild positive correlation between the proportion of Navajo and percentage of population with a disability over the age of 75 in the United States with a correlation coefficient (R) of 0.323 and weighted average of 58.3%, a difference of 29.6%.
Disability Age Over 75 Correlation Summary
| Measurement | Paraguayan | Navajo |
| Minimum | 14.7% | 14.5% |
| Maximum | 62.7% | 100.0% |
| Range | 48.0% | 85.5% |
| Mean | 41.8% | 66.8% |
| Median | 44.8% | 65.0% |
| Interquartile 25% (IQ1) | 33.7% | 53.2% |
| Interquartile 75% (IQ3) | 48.8% | 80.5% |
| Interquartile Range (IQR) | 15.1% | 27.3% |
| Standard Deviation (Sample) | 11.1% | 19.4% |
| Standard Deviation (Population) | 11.0% | 19.3% |
Similar Demographics by Disability Age Over 75
Demographics Similar to Paraguayans by Disability Age Over 75
In terms of disability age over 75, the demographic groups most similar to Paraguayans are Immigrants from Austria (44.9%, a difference of 0.080%), Bulgarian (45.1%, a difference of 0.16%), Okinawan (44.9%, a difference of 0.20%), Lithuanian (45.1%, a difference of 0.21%), and Immigrants from Lithuania (44.9%, a difference of 0.24%).
| Demographics | Rating | Rank | Disability Age Over 75 |
| Immigrants | Ireland | 100.0 /100 | #2 | Exceptional 44.7% |
| Eastern Europeans | 100.0 /100 | #3 | Exceptional 44.8% |
| Carpatho Rusyns | 100.0 /100 | #4 | Exceptional 44.8% |
| Luxembourgers | 100.0 /100 | #5 | Exceptional 44.8% |
| Immigrants | Lithuania | 100.0 /100 | #6 | Exceptional 44.9% |
| Okinawans | 100.0 /100 | #7 | Exceptional 44.9% |
| Immigrants | Austria | 100.0 /100 | #8 | Exceptional 44.9% |
| Paraguayans | 100.0 /100 | #9 | Exceptional 45.0% |
| Bulgarians | 100.0 /100 | #10 | Exceptional 45.1% |
| Lithuanians | 100.0 /100 | #11 | Exceptional 45.1% |
| Immigrants | Czechoslovakia | 100.0 /100 | #12 | Exceptional 45.1% |
| Latvians | 100.0 /100 | #13 | Exceptional 45.1% |
| Immigrants | Scotland | 100.0 /100 | #14 | Exceptional 45.1% |
| Immigrants | Sweden | 100.0 /100 | #15 | Exceptional 45.1% |
| Immigrants | Northern Europe | 100.0 /100 | #16 | Exceptional 45.2% |
Demographics Similar to Navajo by Disability Age Over 75
In terms of disability age over 75, the demographic groups most similar to Navajo are Inupiat (58.4%, a difference of 0.20%), Tsimshian (59.2%, a difference of 1.6%), Tohono O'odham (56.7%, a difference of 2.8%), Lumbee (56.2%, a difference of 3.6%), and Houma (56.2%, a difference of 3.8%).
| Demographics | Rating | Rank | Disability Age Over 75 |
| Apache | 0.0 /100 | #333 | Tragic 53.6% |
| Alaskan Athabascans | 0.0 /100 | #334 | Tragic 54.0% |
| Kiowa | 0.0 /100 | #335 | Tragic 54.2% |
| Immigrants | Armenia | 0.0 /100 | #336 | Tragic 54.3% |
| Yuman | 0.0 /100 | #337 | Tragic 54.4% |
| Colville | 0.0 /100 | #338 | Tragic 55.4% |
| Pima | 0.0 /100 | #339 | Tragic 55.8% |
| Pueblo | 0.0 /100 | #340 | Tragic 55.9% |
| Houma | 0.0 /100 | #341 | Tragic 56.2% |
| Lumbee | 0.0 /100 | #342 | Tragic 56.2% |
| Tohono O'odham | 0.0 /100 | #343 | Tragic 56.7% |
| Navajo | 0.0 /100 | #344 | Tragic 58.3% |
| Inupiat | 0.0 /100 | #345 | Tragic 58.4% |
| Tsimshian | 0.0 /100 | #346 | Tragic 59.2% |
| Yup'ik | 0.0 /100 | #347 | Tragic 61.1% |