Immigrants from Netherlands vs Immigrants from Indonesia Disability Age Over 75
COMPARE
Immigrants from Netherlands
Immigrants from Indonesia
Disability Age Over 75
Disability Age Over 75 Comparison
Immigrants from Netherlands
Immigrants from Indonesia
45.9%
DISABILITY AGE OVER 75
99.6/ 100
METRIC RATING
56th/ 347
METRIC RANK
47.8%
DISABILITY AGE OVER 75
14.2/ 100
METRIC RATING
209th/ 347
METRIC RANK
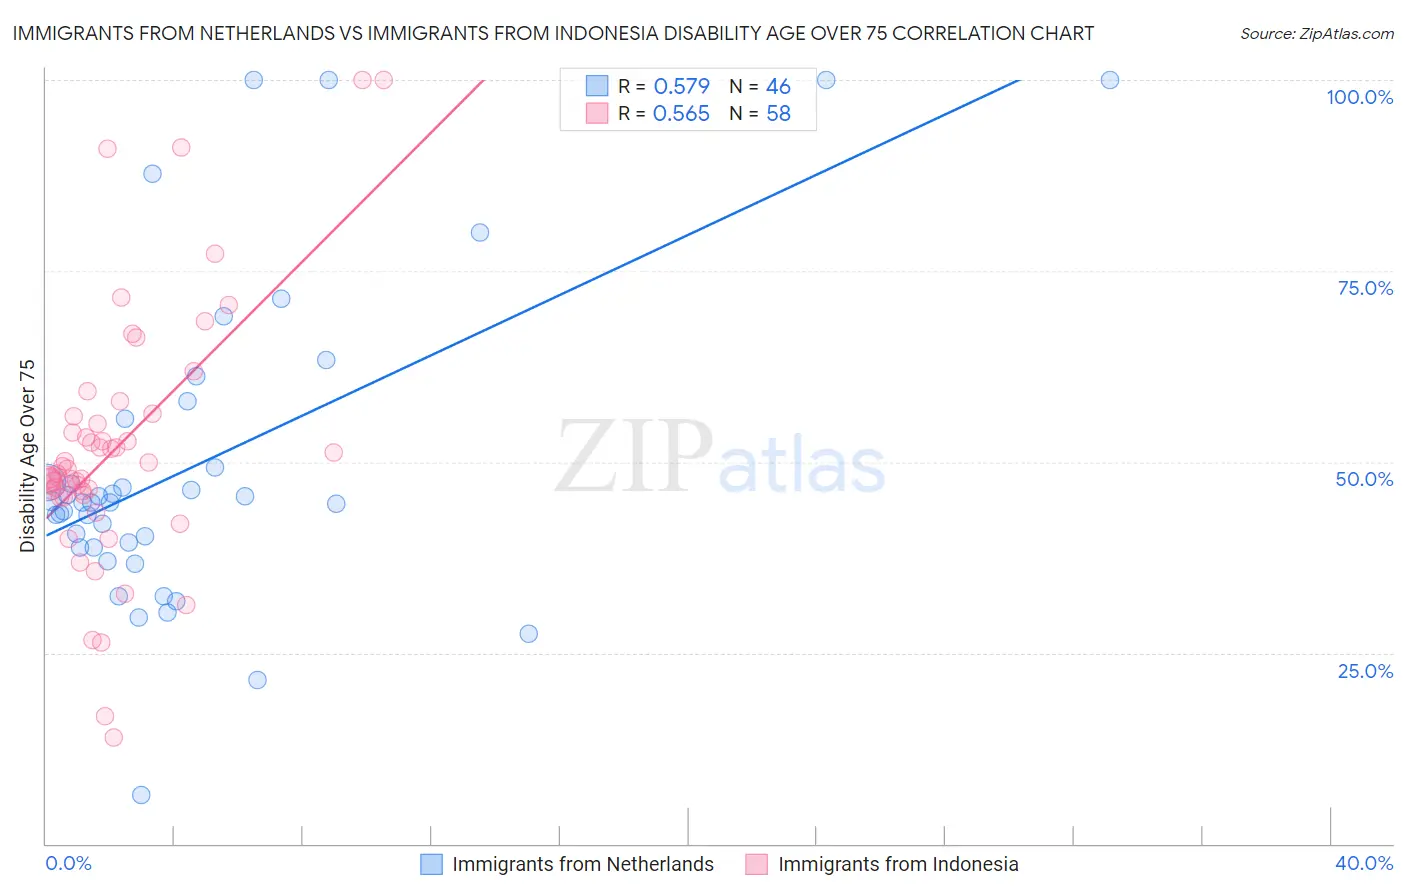
Immigrants from Netherlands vs Immigrants from Indonesia Disability Age Over 75 Correlation Chart
The statistical analysis conducted on geographies consisting of 237,734,358 people shows a substantial positive correlation between the proportion of Immigrants from Netherlands and percentage of population with a disability over the age of 75 in the United States with a correlation coefficient (R) of 0.579 and weighted average of 45.9%. Similarly, the statistical analysis conducted on geographies consisting of 215,623,970 people shows a substantial positive correlation between the proportion of Immigrants from Indonesia and percentage of population with a disability over the age of 75 in the United States with a correlation coefficient (R) of 0.565 and weighted average of 47.8%, a difference of 4.2%.
Disability Age Over 75 Correlation Summary
| Measurement | Immigrants from Netherlands | Immigrants from Indonesia |
| Minimum | 6.3% | 13.9% |
| Maximum | 100.0% | 100.0% |
| Range | 93.7% | 86.1% |
| Mean | 49.7% | 51.8% |
| Median | 44.7% | 48.8% |
| Interquartile 25% (IQ1) | 38.9% | 45.7% |
| Interquartile 75% (IQ3) | 55.7% | 56.0% |
| Interquartile Range (IQR) | 16.8% | 10.3% |
| Standard Deviation (Sample) | 21.0% | 16.9% |
| Standard Deviation (Population) | 20.8% | 16.7% |
Similar Demographics by Disability Age Over 75
Demographics Similar to Immigrants from Netherlands by Disability Age Over 75
In terms of disability age over 75, the demographic groups most similar to Immigrants from Netherlands are Immigrants from Turkey (45.9%, a difference of 0.010%), Immigrants from Israel (45.9%, a difference of 0.020%), Iranian (45.9%, a difference of 0.020%), Immigrants from Europe (45.9%, a difference of 0.020%), and Immigrants from Argentina (45.9%, a difference of 0.050%).
| Demographics | Rating | Rank | Disability Age Over 75 |
| Immigrants | North America | 99.8 /100 | #49 | Exceptional 45.7% |
| Belgians | 99.7 /100 | #50 | Exceptional 45.8% |
| Immigrants | Korea | 99.7 /100 | #51 | Exceptional 45.8% |
| Immigrants | France | 99.7 /100 | #52 | Exceptional 45.8% |
| Immigrants | Italy | 99.7 /100 | #53 | Exceptional 45.8% |
| Slovaks | 99.6 /100 | #54 | Exceptional 45.8% |
| Maltese | 99.6 /100 | #55 | Exceptional 45.8% |
| Immigrants | Netherlands | 99.6 /100 | #56 | Exceptional 45.9% |
| Immigrants | Turkey | 99.6 /100 | #57 | Exceptional 45.9% |
| Immigrants | Israel | 99.6 /100 | #58 | Exceptional 45.9% |
| Iranians | 99.6 /100 | #59 | Exceptional 45.9% |
| Immigrants | Europe | 99.6 /100 | #60 | Exceptional 45.9% |
| Immigrants | Argentina | 99.6 /100 | #61 | Exceptional 45.9% |
| Burmese | 99.5 /100 | #62 | Exceptional 45.9% |
| Immigrants | Norway | 99.5 /100 | #63 | Exceptional 45.9% |
Demographics Similar to Immigrants from Indonesia by Disability Age Over 75
In terms of disability age over 75, the demographic groups most similar to Immigrants from Indonesia are Immigrants from Senegal (47.8%, a difference of 0.11%), Vietnamese (47.9%, a difference of 0.11%), Panamanian (47.9%, a difference of 0.12%), Immigrants from Burma/Myanmar (47.9%, a difference of 0.12%), and Immigrants from Syria (47.8%, a difference of 0.13%).
| Demographics | Rating | Rank | Disability Age Over 75 |
| Immigrants | Bahamas | 20.7 /100 | #202 | Fair 47.7% |
| Trinidadians and Tobagonians | 20.0 /100 | #203 | Fair 47.7% |
| Nigerians | 19.2 /100 | #204 | Poor 47.7% |
| Immigrants | Ghana | 19.1 /100 | #205 | Poor 47.7% |
| Jamaicans | 19.0 /100 | #206 | Poor 47.7% |
| Immigrants | Syria | 17.4 /100 | #207 | Poor 47.8% |
| Immigrants | Senegal | 16.9 /100 | #208 | Poor 47.8% |
| Immigrants | Indonesia | 14.2 /100 | #209 | Poor 47.8% |
| Vietnamese | 11.9 /100 | #210 | Poor 47.9% |
| Panamanians | 11.8 /100 | #211 | Poor 47.9% |
| Immigrants | Burma/Myanmar | 11.7 /100 | #212 | Poor 47.9% |
| Laotians | 11.5 /100 | #213 | Poor 47.9% |
| Immigrants | Barbados | 10.7 /100 | #214 | Poor 47.9% |
| Senegalese | 10.7 /100 | #215 | Poor 47.9% |
| Immigrants | Panama | 10.2 /100 | #216 | Poor 47.9% |