Immigrants from Ghana vs Cajun Disability Age Over 75

COMPARE

Immigrants from Ghana
Race
Ancestry
AfghanAfricanAlaska NativeAlaskan AthabascanAlbanianAleutAlsatianAmericanApacheArabArapahoArgentineanArmenianAssyrian/Chaldean/SyriacAustralianAustrianBahamianBangladeshiBarbadianBasqueBelgianBelizeanBermudanBhutaneseBlackfeetBolivianBrazilianBritishBritish West IndianBulgarianBurmeseCambodianCanadianCape VerdeanCarpatho RusynCelticCentral AmericanCentral American IndianCherokeeCheyenneChickasawChileanChineseChippewaChoctawColombianColvilleComancheCosta RicanCreeCreekCroatianCrowCubanCypriotCzechCzechoslovakianDanishDelawareDominicanDutchDutch West IndianEastern EuropeanEcuadorianEgyptianEnglishEstonianEthiopianEuropeanFijianFilipinoFinnishFrenchFrench American IndianFrench CanadianGermanGerman RussianGhanaianGreekGuamanian/ChamorroGuatemalanGuyaneseHaitianHmongHonduranHopiHoumaHungarianIcelanderIndian (Asian)IndonesianInupiatIranianIraqiIrishIroquoisIsraeliItalianJamaicanJapaneseJordanianKenyanKiowaKoreanLaotianLatvianLebaneseLiberianLithuanianLumbeeLuxembourgerMacedonianMalaysianMalteseMarshalleseMenomineeMexicanMexican American IndianMongolianMoroccanNative HawaiianNavajoNepaleseNew ZealanderNicaraguanNigerianNorthern EuropeanNorwegianOkinawanOsageOttawaPaiutePakistaniPalestinianPanamanianParaguayanPennsylvania GermanPeruvianPimaPolishPortuguesePotawatomiPuebloPuerto RicanPuget Sound SalishRomanianRussianSalvadoranSamoanScandinavianScotch-IrishScottishSeminoleSenegaleseSerbianShoshoneSierra LeoneanSiouxSlavicSlovakSloveneSomaliSouth AfricanSouth AmericanSouth American IndianSoviet UnionSpaniardSpanishSpanish AmericanSpanish American IndianSri LankanSubsaharan AfricanSudaneseSwedishSwissSyrianTaiwaneseThaiTlingit-HaidaTohono O'OdhamTonganTrinidadian and TobagonianTsimshianTurkishU.S. Virgin IslanderUgandanUkrainianUruguayanUteVenezuelanVietnameseWelshWest IndianYakamaYaquiYugoslavianYumanYup'ikZimbabwean
Immigration
NonimmigrantsImmigrantsAfghanistanAfricaAlbaniaArgentinaArmeniaAsiaAustraliaAustriaBahamasBangladeshBarbadosBelarusBelgiumBelizeBoliviaBosnia and HerzegovinaBrazilBulgariaBurma/MyanmarCabo VerdeCambodiaCameroonCanadaCaribbeanCentral AmericaChileChinaColombiaCongoCosta RicaCroatiaCubaCzechoslovakiaDenmarkDominicaDominican RepublicEastern AfricaEastern AsiaEastern EuropeEcuadorEgyptEl SalvadorEnglandEritreaEthiopiaEuropeFijiFranceGermanyGhanaGreeceGrenadaGuatemalaGuyanaHaitiHondurasHong KongHungaryIndiaIndonesiaIranIraqIrelandIsraelItalyJamaicaJapanJordanKazakhstanKenyaKoreaKuwaitLaosLatin AmericaLatviaLebanonLiberiaLithuaniaMalaysiaMexicoMicronesiaMiddle AfricaMoldovaMoroccoNepalNetherlandsNicaraguaNigeriaNorth AmericaNorth MacedoniaNorthern AfricaNorthern EuropeNorwayOceaniaPakistanPanamaPeruPhilippinesPolandPortugalRomaniaRussiaSaudi ArabiaScotlandSenegalSerbiaSierra LeoneSingaporeSomaliaSouth AfricaSouth AmericaSouth Central AsiaSouth Eastern AsiaSouthern EuropeSpainSri LankaSt. Vincent and the GrenadinesSudanSwedenSwitzerlandSyriaTaiwanThailandTrinidad and TobagoTurkeyUgandaUkraineUruguayUzbekistanVenezuelaVietnamWest IndiesWestern AfricaWestern AsiaWestern EuropeYemenZaireZimbabweAzores
Cajun
Race
Ancestry
AfghanAfricanAlaska NativeAlaskan AthabascanAlbanianAleutAlsatianAmericanApacheArabArapahoArgentineanArmenianAssyrian/Chaldean/SyriacAustralianAustrianBahamianBangladeshiBarbadianBasqueBelgianBelizeanBermudanBhutaneseBlackfeetBolivianBrazilianBritishBritish West IndianBulgarianBurmeseCajunCambodianCanadianCape VerdeanCarpatho RusynCelticCentral AmericanCentral American IndianCherokeeCheyenneChickasawChileanChineseChippewaChoctawColombianColvilleComancheCosta RicanCreeCreekCroatianCrowCubanCypriotCzechCzechoslovakianDanishDelawareDominicanDutchDutch West IndianEastern EuropeanEcuadorianEgyptianEnglishEstonianEthiopianEuropeanFijianFilipinoFinnishFrenchFrench American IndianFrench CanadianGermanGerman RussianGhanaianGreekGuamanian/ChamorroGuatemalanGuyaneseHaitianHmongHonduranHopiHoumaHungarianIcelanderIndian (Asian)IndonesianInupiatIranianIraqiIrishIroquoisIsraeliItalianJamaicanJapaneseJordanianKenyanKiowaKoreanLaotianLatvianLebaneseLiberianLithuanianLumbeeLuxembourgerMacedonianMalaysianMalteseMarshalleseMenomineeMexicanMexican American IndianMongolianMoroccanNative HawaiianNavajoNepaleseNew ZealanderNicaraguanNigerianNorthern EuropeanNorwegianOkinawanOsageOttawaPaiutePakistaniPalestinianPanamanianParaguayanPennsylvania GermanPeruvianPimaPolishPortuguesePotawatomiPuebloPuerto RicanPuget Sound SalishRomanianRussianSalvadoranSamoanScandinavianScotch-IrishScottishSeminoleSenegaleseSerbianShoshoneSierra LeoneanSiouxSlavicSlovakSloveneSomaliSouth AfricanSouth AmericanSouth American IndianSoviet UnionSpaniardSpanishSpanish AmericanSpanish American IndianSri LankanSubsaharan AfricanSudaneseSwedishSwissSyrianTaiwaneseThaiTlingit-HaidaTohono O'OdhamTonganTrinidadian and TobagonianTsimshianTurkishU.S. Virgin IslanderUgandanUkrainianUruguayanUteVenezuelanVietnameseWelshWest IndianYakamaYaquiYugoslavianYumanYup'ikZimbabwean
Immigration
NonimmigrantsImmigrantsAfghanistanAfricaAlbaniaArgentinaArmeniaAsiaAustraliaAustriaBahamasBangladeshBarbadosBelarusBelgiumBelizeBoliviaBosnia and HerzegovinaBrazilBulgariaBurma/MyanmarCabo VerdeCambodiaCameroonCanadaCaribbeanCentral AmericaChileChinaColombiaCongoCosta RicaCroatiaCubaCzechoslovakiaDenmarkDominicaDominican RepublicEastern AfricaEastern AsiaEastern EuropeEcuadorEgyptEl SalvadorEnglandEritreaEthiopiaEuropeFijiFranceGermanyGreeceGrenadaGuatemalaGuyanaHaitiHondurasHong KongHungaryIndiaIndonesiaIranIraqIrelandIsraelItalyJamaicaJapanJordanKazakhstanKenyaKoreaKuwaitLaosLatin AmericaLatviaLebanonLiberiaLithuaniaMalaysiaMexicoMicronesiaMiddle AfricaMoldovaMoroccoNepalNetherlandsNicaraguaNigeriaNorth AmericaNorth MacedoniaNorthern AfricaNorthern EuropeNorwayOceaniaPakistanPanamaPeruPhilippinesPolandPortugalRomaniaRussiaSaudi ArabiaScotlandSenegalSerbiaSierra LeoneSingaporeSomaliaSouth AfricaSouth AmericaSouth Central AsiaSouth Eastern AsiaSouthern EuropeSpainSri LankaSt. Vincent and the GrenadinesSudanSwedenSwitzerlandSyriaTaiwanThailandTrinidad and TobagoTurkeyUgandaUkraineUruguayUzbekistanVenezuelaVietnamWest IndiesWestern AfricaWestern AsiaWestern EuropeYemenZaireZimbabweAzores
Disability Age Over 75
Income
Poverty
Unemployment
Labor Participation
Family Structure
Vehicle Availability
Education Level
Disability

Disability Age Over 75 Comparison

Immigrants from Ghana

Cajuns

Poor
Tragic
47.7%
DISABILITY AGE OVER 75
19.1/ 100
METRIC RATING
205th/ 347
METRIC RANK
50.7%
DISABILITY AGE OVER 75
0.0/ 100
METRIC RATING
311th/ 347
METRIC RANK

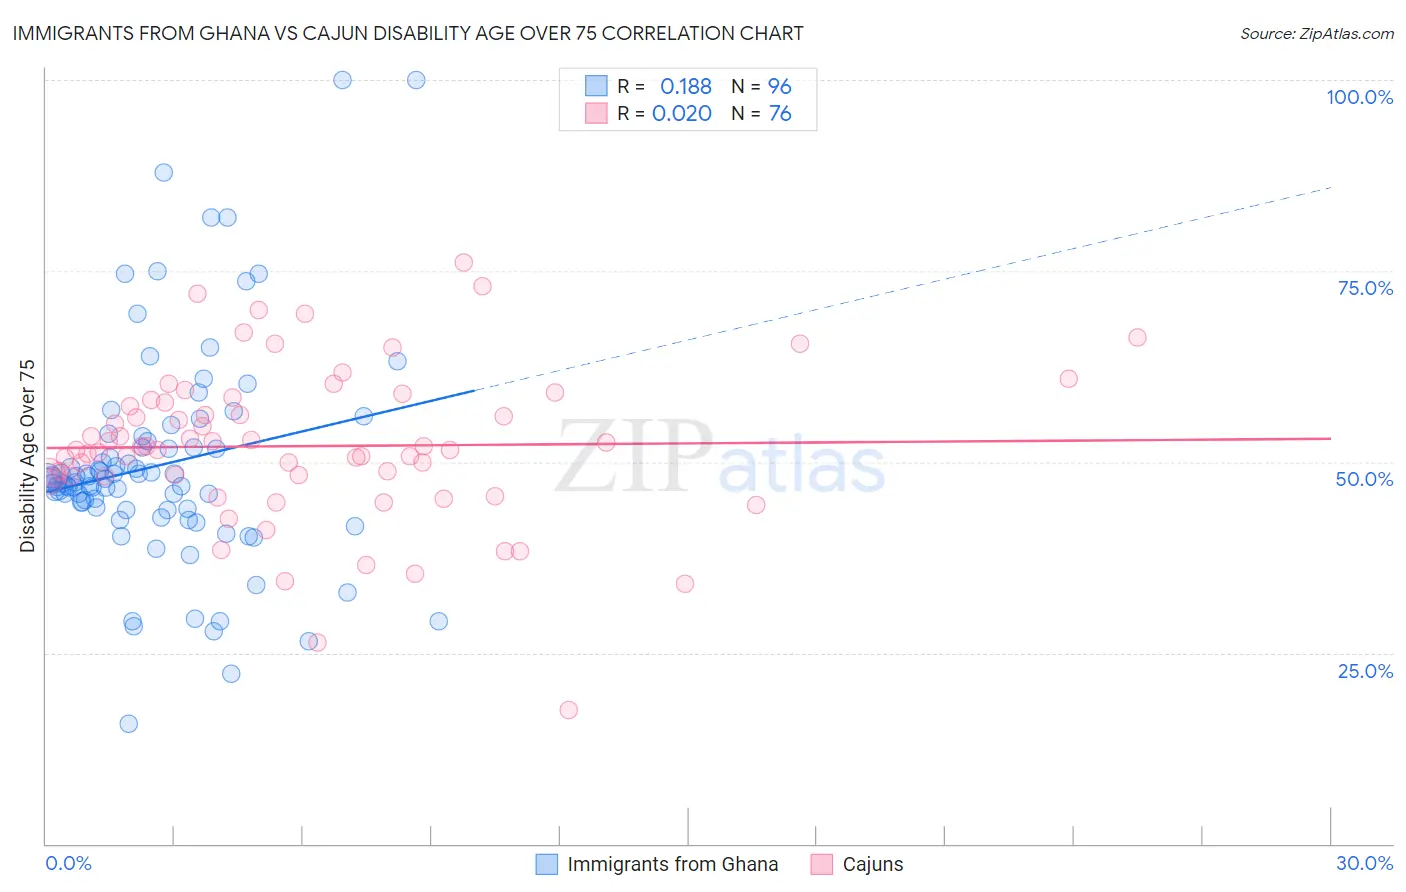
Immigrants from Ghana vs Cajun Disability Age Over 75 Correlation Chart

The statistical analysis conducted on geographies consisting of 199,494,871 people shows a poor positive correlation between the proportion of Immigrants from Ghana and percentage of population with a disability over the age of 75 in the United States with a correlation coefficient (R) of 0.188 and weighted average of 47.7%. Similarly, the statistical analysis conducted on geographies consisting of 149,580,177 people shows no correlation between the proportion of Cajuns and percentage of population with a disability over the age of 75 in the United States with a correlation coefficient (R) of 0.020 and weighted average of 50.7%, a difference of 6.1%.
Immigrants from Ghana vs Cajun Disability Age Over 75

Disability Age Over 75 Correlation Summary

MeasurementImmigrants from GhanaCajun
Minimum15.7%17.5%
Maximum100.0%76.2%
Range84.3%58.7%
Mean49.6%52.1%
Median47.4%51.8%
Interquartile 25% (IQ1)43.8%48.1%
Interquartile 75% (IQ3)52.3%58.0%
Interquartile Range (IQR)8.6%9.9%
Standard Deviation (Sample)14.4%10.3%
Standard Deviation (Population)14.3%10.2%

Similar Demographics by Disability Age Over 75

Demographics Similar to Immigrants from Ghana by Disability Age Over 75

In terms of disability age over 75, the demographic groups most similar to Immigrants from Ghana are Jamaican (47.7%, a difference of 0.0%), Nigerian (47.7%, a difference of 0.010%), Trinidadian and Tobagonian (47.7%, a difference of 0.030%), Immigrants from Cuba (47.7%, a difference of 0.060%), and Immigrants from Bahamas (47.7%, a difference of 0.060%).
DemographicsRating | RankDisability Age Over 75
Immigrants | Ukraine
23.2
/100
|
#198
Fair
47.7%
Immigrants | Eritrea
22.4
/100
|
#199
Fair
47.7%
Immigrants | Somalia
21.4
/100
|
#200
Fair
47.7%
Immigrants | Cuba
20.9
/100
|
#201
Fair
47.7%
Immigrants | Bahamas
20.7
/100
|
#202
Fair
47.7%
Trinidadians and Tobagonians
20.0
/100
|
#203
Fair
47.7%
Nigerians
19.2
/100
|
#204
Poor
47.7%
Immigrants | Ghana
19.1
/100
|
#205
Poor
47.7%
Jamaicans
19.0
/100
|
#206
Poor
47.7%
Immigrants | Syria
17.4
/100
|
#207
Poor
47.8%
Immigrants | Senegal
16.9
/100
|
#208
Poor
47.8%
Immigrants | Indonesia
14.2
/100
|
#209
Poor
47.8%
Vietnamese
11.9
/100
|
#210
Poor
47.9%
Panamanians
11.8
/100
|
#211
Poor
47.9%
Immigrants | Burma/Myanmar
11.7
/100
|
#212
Poor
47.9%

Demographics Similar to Cajuns by Disability Age Over 75

In terms of disability age over 75, the demographic groups most similar to Cajuns are Tlingit-Haida (50.6%, a difference of 0.10%), Hispanic or Latino (50.6%, a difference of 0.14%), Aleut (50.6%, a difference of 0.14%), Immigrants from Fiji (50.6%, a difference of 0.16%), and Immigrants from Central America (50.5%, a difference of 0.22%).
DemographicsRating | RankDisability Age Over 75
Immigrants | Dominican Republic
0.0
/100
|
#304
Tragic
50.3%
Central American Indians
0.0
/100
|
#305
Tragic
50.5%
Immigrants | Central America
0.0
/100
|
#306
Tragic
50.5%
Immigrants | Fiji
0.0
/100
|
#307
Tragic
50.6%
Hispanics or Latinos
0.0
/100
|
#308
Tragic
50.6%
Aleuts
0.0
/100
|
#309
Tragic
50.6%
Tlingit-Haida
0.0
/100
|
#310
Tragic
50.6%
Cajuns
0.0
/100
|
#311
Tragic
50.7%
Cheyenne
0.0
/100
|
#312
Tragic
50.9%
Immigrants | Azores
0.0
/100
|
#313
Tragic
50.9%
Immigrants | Mexico
0.0
/100
|
#314
Tragic
51.1%
Mexicans
0.0
/100
|
#315
Tragic
51.1%
Chickasaw
0.0
/100
|
#316
Tragic
51.2%
Yakama
0.0
/100
|
#317
Tragic
51.3%
Seminole
0.0
/100
|
#318
Tragic
51.5%