Romanian vs Cajun Disability Age Over 75
COMPARE
Romanian
Cajun
Disability Age Over 75
Disability Age Over 75 Comparison
Romanians
Cajuns
46.2%
DISABILITY AGE OVER 75
98.6/ 100
METRIC RATING
86th/ 347
METRIC RANK
50.7%
DISABILITY AGE OVER 75
0.0/ 100
METRIC RATING
311th/ 347
METRIC RANK
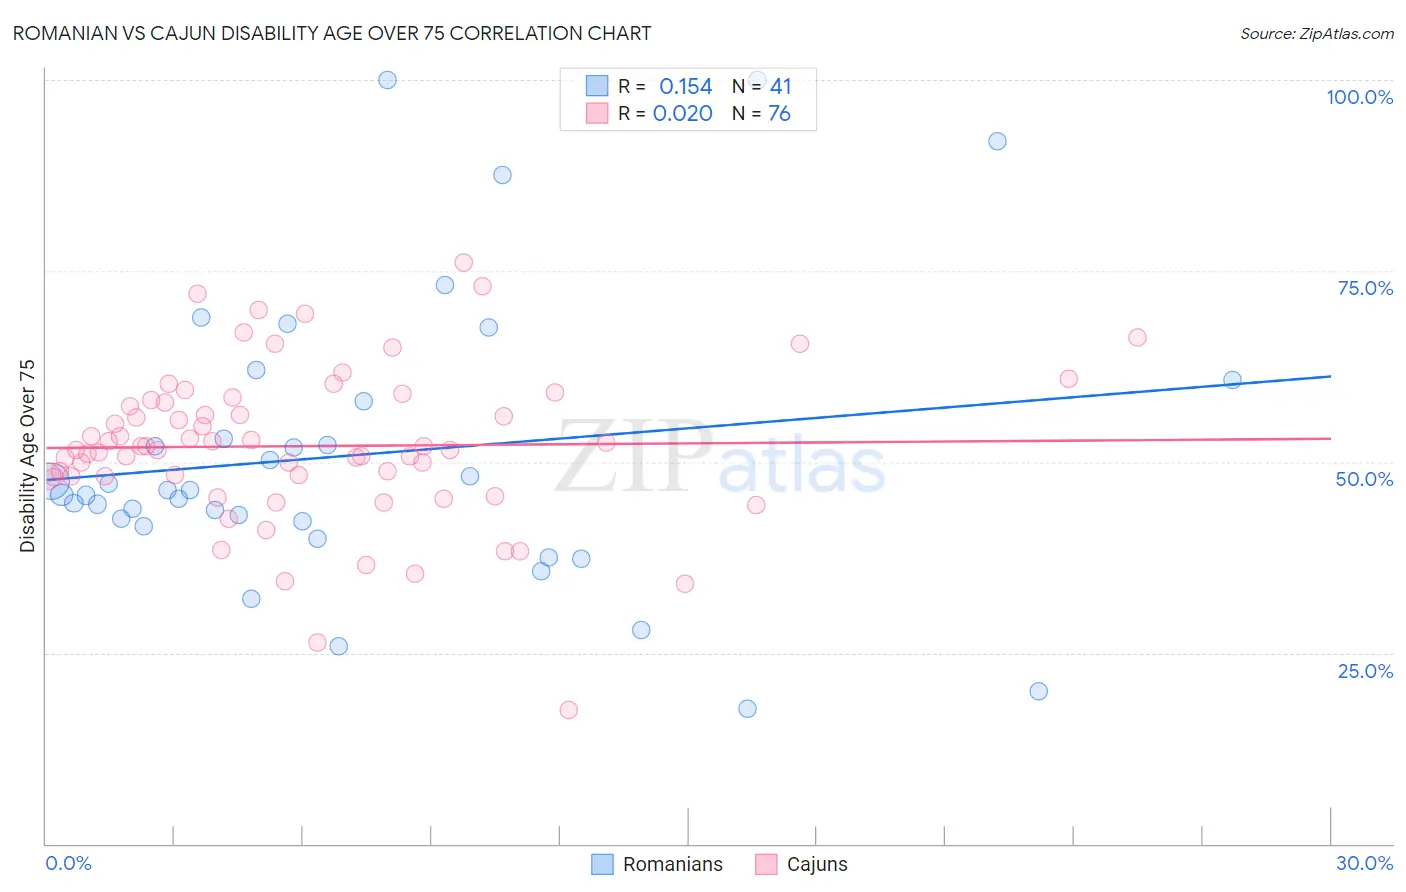
Romanian vs Cajun Disability Age Over 75 Correlation Chart
The statistical analysis conducted on geographies consisting of 377,383,328 people shows a poor positive correlation between the proportion of Romanians and percentage of population with a disability over the age of 75 in the United States with a correlation coefficient (R) of 0.154 and weighted average of 46.2%. Similarly, the statistical analysis conducted on geographies consisting of 149,580,177 people shows no correlation between the proportion of Cajuns and percentage of population with a disability over the age of 75 in the United States with a correlation coefficient (R) of 0.020 and weighted average of 50.7%, a difference of 9.6%.
Disability Age Over 75 Correlation Summary
| Measurement | Romanian | Cajun |
| Minimum | 17.6% | 17.5% |
| Maximum | 100.0% | 76.2% |
| Range | 82.4% | 58.7% |
| Mean | 51.0% | 52.1% |
| Median | 46.3% | 51.8% |
| Interquartile 25% (IQ1) | 41.8% | 48.1% |
| Interquartile 75% (IQ3) | 59.3% | 58.0% |
| Interquartile Range (IQR) | 17.5% | 9.9% |
| Standard Deviation (Sample) | 19.0% | 10.3% |
| Standard Deviation (Population) | 18.8% | 10.2% |
Similar Demographics by Disability Age Over 75
Demographics Similar to Romanians by Disability Age Over 75
In terms of disability age over 75, the demographic groups most similar to Romanians are Immigrants from Southern Europe (46.2%, a difference of 0.0%), Danish (46.2%, a difference of 0.0%), Immigrants from Jordan (46.2%, a difference of 0.020%), Immigrants from Latvia (46.2%, a difference of 0.030%), and Argentinean (46.2%, a difference of 0.030%).
| Demographics | Rating | Rank | Disability Age Over 75 |
| Swiss | 98.8 /100 | #79 | Exceptional 46.2% |
| Soviet Union | 98.8 /100 | #80 | Exceptional 46.2% |
| New Zealanders | 98.8 /100 | #81 | Exceptional 46.2% |
| Immigrants | Latvia | 98.7 /100 | #82 | Exceptional 46.2% |
| Argentineans | 98.7 /100 | #83 | Exceptional 46.2% |
| Immigrants | Jordan | 98.7 /100 | #84 | Exceptional 46.2% |
| Immigrants | Southern Europe | 98.6 /100 | #85 | Exceptional 46.2% |
| Romanians | 98.6 /100 | #86 | Exceptional 46.2% |
| Danes | 98.6 /100 | #87 | Exceptional 46.2% |
| Uruguayans | 98.4 /100 | #88 | Exceptional 46.2% |
| Immigrants | Saudi Arabia | 98.4 /100 | #89 | Exceptional 46.3% |
| Northern Europeans | 98.3 /100 | #90 | Exceptional 46.3% |
| Immigrants | Egypt | 98.3 /100 | #91 | Exceptional 46.3% |
| Germans | 98.2 /100 | #92 | Exceptional 46.3% |
| Ugandans | 98.2 /100 | #93 | Exceptional 46.3% |
Demographics Similar to Cajuns by Disability Age Over 75
In terms of disability age over 75, the demographic groups most similar to Cajuns are Tlingit-Haida (50.6%, a difference of 0.10%), Hispanic or Latino (50.6%, a difference of 0.14%), Aleut (50.6%, a difference of 0.14%), Immigrants from Fiji (50.6%, a difference of 0.16%), and Immigrants from Central America (50.5%, a difference of 0.22%).
| Demographics | Rating | Rank | Disability Age Over 75 |
| Immigrants | Dominican Republic | 0.0 /100 | #304 | Tragic 50.3% |
| Central American Indians | 0.0 /100 | #305 | Tragic 50.5% |
| Immigrants | Central America | 0.0 /100 | #306 | Tragic 50.5% |
| Immigrants | Fiji | 0.0 /100 | #307 | Tragic 50.6% |
| Hispanics or Latinos | 0.0 /100 | #308 | Tragic 50.6% |
| Aleuts | 0.0 /100 | #309 | Tragic 50.6% |
| Tlingit-Haida | 0.0 /100 | #310 | Tragic 50.6% |
| Cajuns | 0.0 /100 | #311 | Tragic 50.7% |
| Cheyenne | 0.0 /100 | #312 | Tragic 50.9% |
| Immigrants | Azores | 0.0 /100 | #313 | Tragic 50.9% |
| Immigrants | Mexico | 0.0 /100 | #314 | Tragic 51.1% |
| Mexicans | 0.0 /100 | #315 | Tragic 51.1% |
| Chickasaw | 0.0 /100 | #316 | Tragic 51.2% |
| Yakama | 0.0 /100 | #317 | Tragic 51.3% |
| Seminole | 0.0 /100 | #318 | Tragic 51.5% |