Immigrants from Morocco vs Cajun Professional Degree
COMPARE
Immigrants from Morocco
Cajun
Professional Degree
Professional Degree Comparison
Immigrants from Morocco
Cajuns
5.0%
PROFESSIONAL DEGREE
96.8/ 100
METRIC RATING
114th/ 347
METRIC RANK
3.4%
PROFESSIONAL DEGREE
0.2/ 100
METRIC RATING
304th/ 347
METRIC RANK
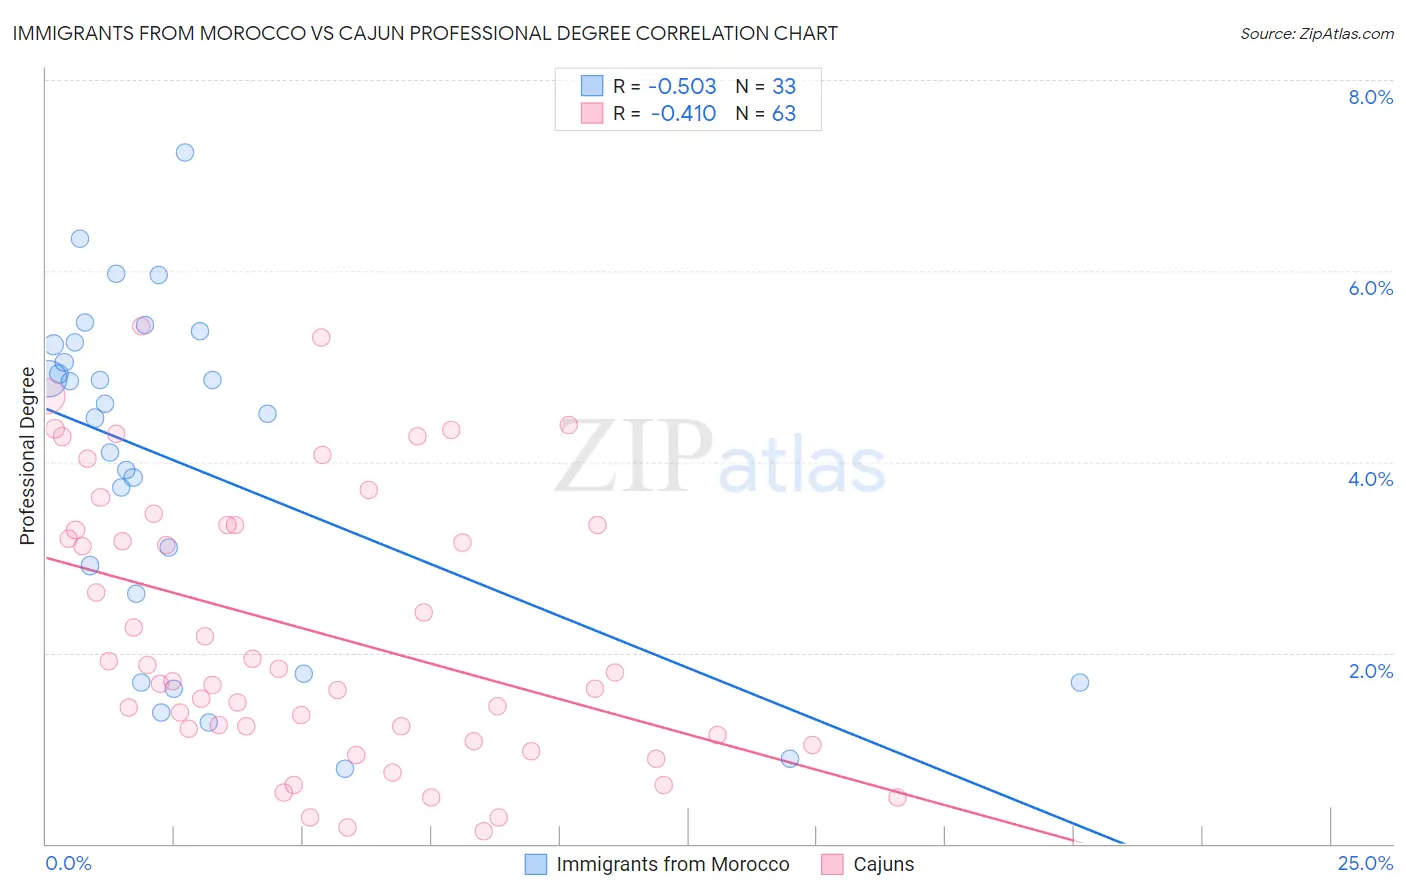
Immigrants from Morocco vs Cajun Professional Degree Correlation Chart
The statistical analysis conducted on geographies consisting of 178,862,837 people shows a substantial negative correlation between the proportion of Immigrants from Morocco and percentage of population with at least professional degree education in the United States with a correlation coefficient (R) of -0.503 and weighted average of 5.0%. Similarly, the statistical analysis conducted on geographies consisting of 149,296,095 people shows a moderate negative correlation between the proportion of Cajuns and percentage of population with at least professional degree education in the United States with a correlation coefficient (R) of -0.410 and weighted average of 3.4%, a difference of 47.0%.
Professional Degree Correlation Summary
| Measurement | Immigrants from Morocco | Cajun |
| Minimum | 0.78% | 0.14% |
| Maximum | 7.2% | 5.4% |
| Range | 6.4% | 5.3% |
| Mean | 4.0% | 2.2% |
| Median | 4.5% | 1.8% |
| Interquartile 25% (IQ1) | 2.2% | 1.1% |
| Interquartile 75% (IQ3) | 5.2% | 3.3% |
| Interquartile Range (IQR) | 3.0% | 2.2% |
| Standard Deviation (Sample) | 1.8% | 1.4% |
| Standard Deviation (Population) | 1.7% | 1.4% |
Similar Demographics by Professional Degree
Demographics Similar to Immigrants from Morocco by Professional Degree
In terms of professional degree, the demographic groups most similar to Immigrants from Morocco are Moroccan (5.0%, a difference of 0.10%), Immigrants from Pakistan (5.0%, a difference of 0.45%), Taiwanese (5.0%, a difference of 0.47%), Venezuelan (4.9%, a difference of 0.57%), and Brazilian (5.0%, a difference of 0.69%).
| Demographics | Rating | Rank | Professional Degree |
| Maltese | 98.1 /100 | #107 | Exceptional 5.0% |
| Immigrants | Southern Europe | 98.1 /100 | #108 | Exceptional 5.0% |
| British | 98.0 /100 | #109 | Exceptional 5.0% |
| Lebanese | 98.0 /100 | #110 | Exceptional 5.0% |
| Brazilians | 97.4 /100 | #111 | Exceptional 5.0% |
| Taiwanese | 97.3 /100 | #112 | Exceptional 5.0% |
| Immigrants | Pakistan | 97.2 /100 | #113 | Exceptional 5.0% |
| Immigrants | Morocco | 96.8 /100 | #114 | Exceptional 5.0% |
| Moroccans | 96.8 /100 | #115 | Exceptional 5.0% |
| Venezuelans | 96.3 /100 | #116 | Exceptional 4.9% |
| Immigrants | Syria | 96.0 /100 | #117 | Exceptional 4.9% |
| Croatians | 96.0 /100 | #118 | Exceptional 4.9% |
| Immigrants | Sudan | 95.4 /100 | #119 | Exceptional 4.9% |
| Albanians | 95.3 /100 | #120 | Exceptional 4.9% |
| Immigrants | Moldova | 94.8 /100 | #121 | Exceptional 4.9% |
Demographics Similar to Cajuns by Professional Degree
In terms of professional degree, the demographic groups most similar to Cajuns are Immigrants from Haiti (3.4%, a difference of 0.010%), Chickasaw (3.4%, a difference of 0.30%), Cape Verdean (3.4%, a difference of 0.31%), Malaysian (3.4%, a difference of 0.66%), and Immigrants from Dominican Republic (3.4%, a difference of 0.77%).
| Demographics | Rating | Rank | Professional Degree |
| Immigrants | Liberia | 0.2 /100 | #297 | Tragic 3.4% |
| Ottawa | 0.2 /100 | #298 | Tragic 3.4% |
| Immigrants | Yemen | 0.2 /100 | #299 | Tragic 3.4% |
| Blacks/African Americans | 0.2 /100 | #300 | Tragic 3.4% |
| Immigrants | Dominican Republic | 0.2 /100 | #301 | Tragic 3.4% |
| Malaysians | 0.2 /100 | #302 | Tragic 3.4% |
| Immigrants | Haiti | 0.2 /100 | #303 | Tragic 3.4% |
| Cajuns | 0.2 /100 | #304 | Tragic 3.4% |
| Chickasaw | 0.1 /100 | #305 | Tragic 3.4% |
| Cape Verdeans | 0.1 /100 | #306 | Tragic 3.4% |
| Samoans | 0.1 /100 | #307 | Tragic 3.3% |
| Shoshone | 0.1 /100 | #308 | Tragic 3.3% |
| Pima | 0.1 /100 | #309 | Tragic 3.3% |
| Immigrants | Latin America | 0.1 /100 | #310 | Tragic 3.3% |
| Cherokee | 0.1 /100 | #311 | Tragic 3.3% |