Immigrants from Morocco vs Bhutanese Single Mother Poverty
COMPARE
Immigrants from Morocco
Bhutanese
Single Mother Poverty
Single Mother Poverty Comparison
Immigrants from Morocco
Bhutanese
28.4%
SINGLE MOTHER POVERTY
89.5/ 100
METRIC RATING
132nd/ 347
METRIC RANK
25.6%
SINGLE MOTHER POVERTY
100.0/ 100
METRIC RATING
12th/ 347
METRIC RANK
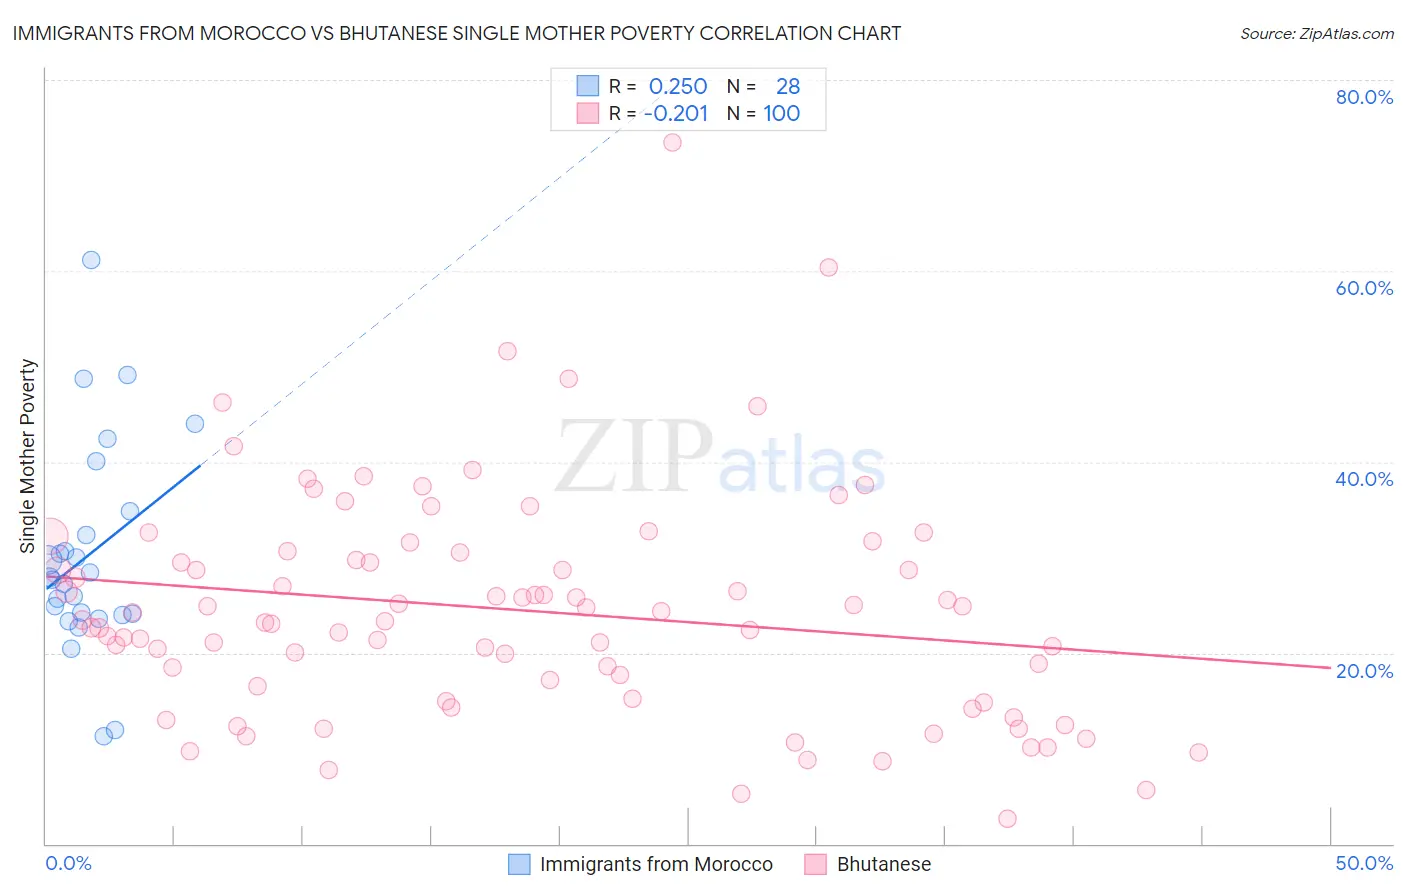
Immigrants from Morocco vs Bhutanese Single Mother Poverty Correlation Chart
The statistical analysis conducted on geographies consisting of 176,937,771 people shows a weak positive correlation between the proportion of Immigrants from Morocco and poverty level among single mothers in the United States with a correlation coefficient (R) of 0.250 and weighted average of 28.4%. Similarly, the statistical analysis conducted on geographies consisting of 442,258,638 people shows a weak negative correlation between the proportion of Bhutanese and poverty level among single mothers in the United States with a correlation coefficient (R) of -0.201 and weighted average of 25.6%, a difference of 10.9%.
Single Mother Poverty Correlation Summary
| Measurement | Immigrants from Morocco | Bhutanese |
| Minimum | 11.2% | 2.6% |
| Maximum | 61.2% | 73.4% |
| Range | 49.9% | 70.8% |
| Mean | 30.2% | 24.4% |
| Median | 27.8% | 23.4% |
| Interquartile 25% (IQ1) | 24.0% | 15.9% |
| Interquartile 75% (IQ3) | 33.6% | 30.2% |
| Interquartile Range (IQR) | 9.6% | 14.3% |
| Standard Deviation (Sample) | 11.0% | 11.8% |
| Standard Deviation (Population) | 10.8% | 11.8% |
Similar Demographics by Single Mother Poverty
Demographics Similar to Immigrants from Morocco by Single Mother Poverty
In terms of single mother poverty, the demographic groups most similar to Immigrants from Morocco are Swedish (28.4%, a difference of 0.0%), Immigrants from Southern Europe (28.4%, a difference of 0.030%), Immigrants from Spain (28.4%, a difference of 0.030%), Native Hawaiian (28.4%, a difference of 0.070%), and Immigrants from Canada (28.4%, a difference of 0.070%).
| Demographics | Rating | Rank | Single Mother Poverty |
| Kenyans | 90.9 /100 | #125 | Exceptional 28.4% |
| Immigrants | Chile | 90.8 /100 | #126 | Exceptional 28.4% |
| Poles | 90.8 /100 | #127 | Exceptional 28.4% |
| Immigrants | England | 90.5 /100 | #128 | Exceptional 28.4% |
| South Americans | 90.4 /100 | #129 | Exceptional 28.4% |
| Norwegians | 90.4 /100 | #130 | Exceptional 28.4% |
| Immigrants | Austria | 90.3 /100 | #131 | Exceptional 28.4% |
| Immigrants | Morocco | 89.5 /100 | #132 | Excellent 28.4% |
| Swedes | 89.4 /100 | #133 | Excellent 28.4% |
| Immigrants | Southern Europe | 89.2 /100 | #134 | Excellent 28.4% |
| Immigrants | Spain | 89.2 /100 | #135 | Excellent 28.4% |
| Native Hawaiians | 88.9 /100 | #136 | Excellent 28.4% |
| Immigrants | Canada | 88.9 /100 | #137 | Excellent 28.4% |
| Immigrants | Belgium | 88.5 /100 | #138 | Excellent 28.5% |
| Samoans | 88.1 /100 | #139 | Excellent 28.5% |
Demographics Similar to Bhutanese by Single Mother Poverty
In terms of single mother poverty, the demographic groups most similar to Bhutanese are Iranian (25.5%, a difference of 0.37%), Indian (Asian) (25.8%, a difference of 0.52%), Immigrants from Singapore (25.8%, a difference of 0.67%), Immigrants from Ireland (25.8%, a difference of 0.86%), and Bolivian (25.9%, a difference of 1.1%).
| Demographics | Rating | Rank | Single Mother Poverty |
| Immigrants | Hong Kong | 100.0 /100 | #5 | Exceptional 24.4% |
| Thais | 100.0 /100 | #6 | Exceptional 24.5% |
| Chinese | 100.0 /100 | #7 | Exceptional 24.6% |
| Immigrants | Iran | 100.0 /100 | #8 | Exceptional 25.1% |
| Immigrants | Lithuania | 100.0 /100 | #9 | Exceptional 25.2% |
| Immigrants | South Central Asia | 100.0 /100 | #10 | Exceptional 25.3% |
| Iranians | 100.0 /100 | #11 | Exceptional 25.5% |
| Bhutanese | 100.0 /100 | #12 | Exceptional 25.6% |
| Indians (Asian) | 100.0 /100 | #13 | Exceptional 25.8% |
| Immigrants | Singapore | 100.0 /100 | #14 | Exceptional 25.8% |
| Immigrants | Ireland | 100.0 /100 | #15 | Exceptional 25.8% |
| Bolivians | 100.0 /100 | #16 | Exceptional 25.9% |
| Asians | 100.0 /100 | #17 | Exceptional 26.0% |
| Immigrants | Pakistan | 100.0 /100 | #18 | Exceptional 26.0% |
| Immigrants | Eastern Asia | 100.0 /100 | #19 | Exceptional 26.1% |