Immigrants from Yemen vs Pennsylvania German Hearing Disability
COMPARE
Immigrants from Yemen
Pennsylvania German
Hearing Disability
Hearing Disability Comparison
Immigrants from Yemen
Pennsylvania Germans
2.8%
HEARING DISABILITY
92.7/ 100
METRIC RATING
111th/ 347
METRIC RANK
3.7%
HEARING DISABILITY
0.0/ 100
METRIC RATING
301st/ 347
METRIC RANK
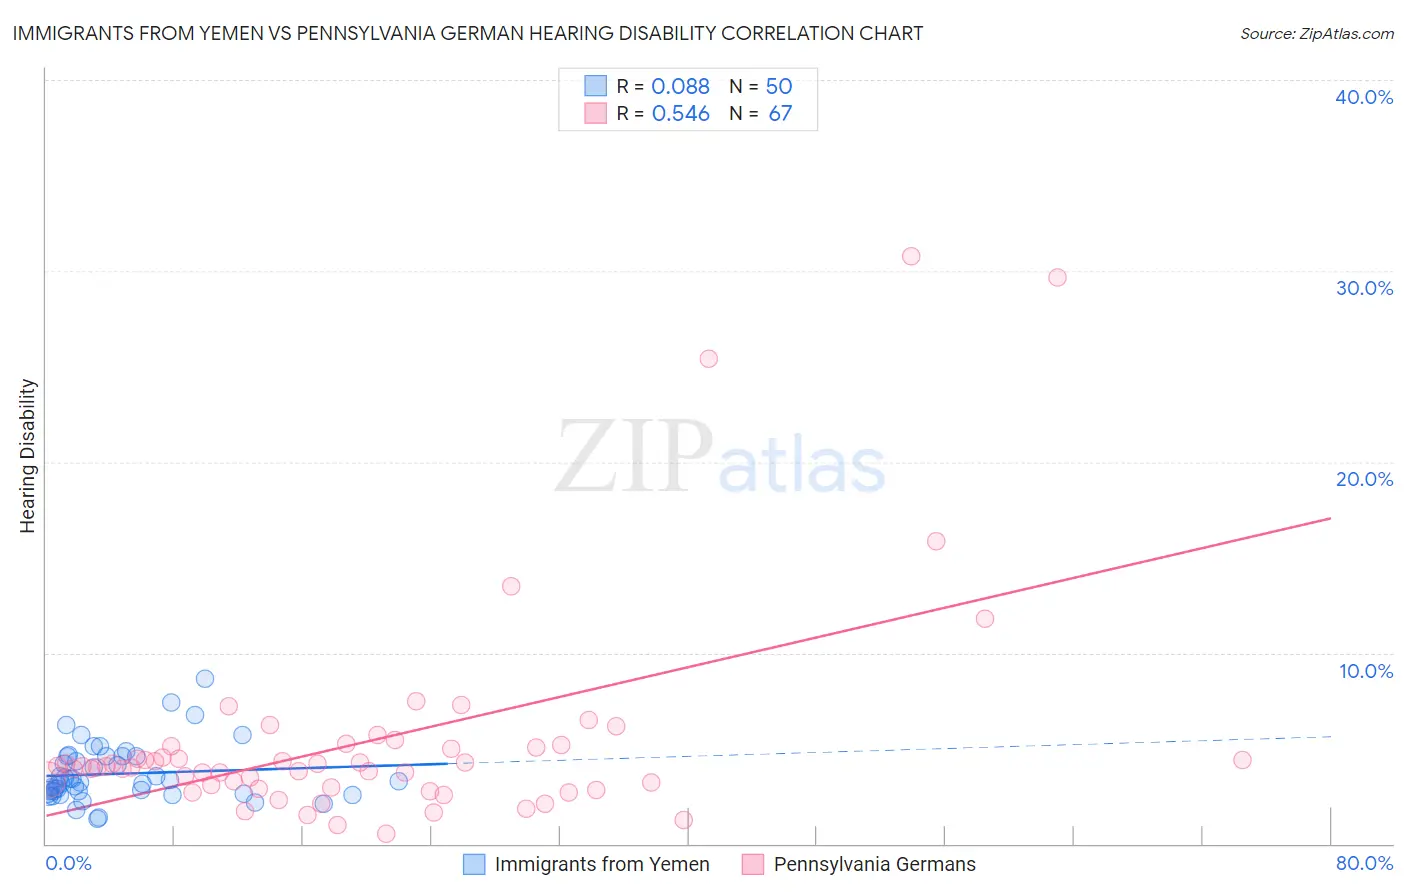
Immigrants from Yemen vs Pennsylvania German Hearing Disability Correlation Chart
The statistical analysis conducted on geographies consisting of 82,433,214 people shows a slight positive correlation between the proportion of Immigrants from Yemen and percentage of population with hearing disability in the United States with a correlation coefficient (R) of 0.088 and weighted average of 2.8%. Similarly, the statistical analysis conducted on geographies consisting of 234,065,533 people shows a substantial positive correlation between the proportion of Pennsylvania Germans and percentage of population with hearing disability in the United States with a correlation coefficient (R) of 0.546 and weighted average of 3.7%, a difference of 32.7%.
Hearing Disability Correlation Summary
| Measurement | Immigrants from Yemen | Pennsylvania German |
| Minimum | 1.3% | 0.51% |
| Maximum | 8.6% | 30.8% |
| Range | 7.3% | 30.3% |
| Mean | 3.7% | 5.4% |
| Median | 3.2% | 4.0% |
| Interquartile 25% (IQ1) | 2.7% | 3.0% |
| Interquartile 75% (IQ3) | 4.6% | 5.1% |
| Interquartile Range (IQR) | 1.9% | 2.1% |
| Standard Deviation (Sample) | 1.5% | 5.7% |
| Standard Deviation (Population) | 1.5% | 5.6% |
Similar Demographics by Hearing Disability
Demographics Similar to Immigrants from Yemen by Hearing Disability
In terms of hearing disability, the demographic groups most similar to Immigrants from Yemen are Cypriot (2.8%, a difference of 0.050%), U.S. Virgin Islander (2.8%, a difference of 0.070%), Turkish (2.8%, a difference of 0.10%), Guatemalan (2.8%, a difference of 0.17%), and Honduran (2.8%, a difference of 0.25%).
| Demographics | Rating | Rank | Hearing Disability |
| Burmese | 94.2 /100 | #104 | Exceptional 2.8% |
| Moroccans | 93.9 /100 | #105 | Exceptional 2.8% |
| Hondurans | 93.4 /100 | #106 | Exceptional 2.8% |
| Immigrants | Chile | 93.4 /100 | #107 | Exceptional 2.8% |
| Guatemalans | 93.2 /100 | #108 | Exceptional 2.8% |
| Turks | 93.0 /100 | #109 | Exceptional 2.8% |
| Cypriots | 92.9 /100 | #110 | Exceptional 2.8% |
| Immigrants | Yemen | 92.7 /100 | #111 | Exceptional 2.8% |
| U.S. Virgin Islanders | 92.5 /100 | #112 | Exceptional 2.8% |
| Immigrants | Belarus | 91.6 /100 | #113 | Exceptional 2.8% |
| Cambodians | 91.1 /100 | #114 | Exceptional 2.8% |
| Immigrants | Latin America | 90.5 /100 | #115 | Exceptional 2.8% |
| Immigrants | Immigrants | 90.3 /100 | #116 | Exceptional 2.8% |
| Immigrants | Liberia | 90.0 /100 | #117 | Excellent 2.8% |
| Zimbabweans | 89.9 /100 | #118 | Excellent 2.8% |
Demographics Similar to Pennsylvania Germans by Hearing Disability
In terms of hearing disability, the demographic groups most similar to Pennsylvania Germans are Scottish (3.7%, a difference of 0.030%), German (3.7%, a difference of 0.090%), Dutch (3.7%, a difference of 0.11%), Menominee (3.7%, a difference of 0.16%), and Celtic (3.7%, a difference of 0.37%).
| Demographics | Rating | Rank | Hearing Disability |
| Iroquois | 0.0 /100 | #294 | Tragic 3.7% |
| Welsh | 0.0 /100 | #295 | Tragic 3.7% |
| Pima | 0.0 /100 | #296 | Tragic 3.7% |
| Immigrants | Azores | 0.0 /100 | #297 | Tragic 3.7% |
| Celtics | 0.0 /100 | #298 | Tragic 3.7% |
| Germans | 0.0 /100 | #299 | Tragic 3.7% |
| Scottish | 0.0 /100 | #300 | Tragic 3.7% |
| Pennsylvania Germans | 0.0 /100 | #301 | Tragic 3.7% |
| Dutch | 0.0 /100 | #302 | Tragic 3.7% |
| Menominee | 0.0 /100 | #303 | Tragic 3.7% |
| French | 0.0 /100 | #304 | Tragic 3.8% |
| English | 0.0 /100 | #305 | Tragic 3.8% |
| Marshallese | 0.0 /100 | #306 | Tragic 3.8% |
| French Canadians | 0.0 /100 | #307 | Tragic 3.8% |
| Ottawa | 0.0 /100 | #308 | Tragic 3.8% |