Immigrants from Middle Africa vs Immigrants from Western Africa Disability
COMPARE
Immigrants from Middle Africa
Immigrants from Western Africa
Disability
Disability Comparison
Immigrants from Middle Africa
Immigrants from Western Africa
11.6%
DISABILITY
69.5/ 100
METRIC RATING
157th/ 347
METRIC RANK
11.7%
DISABILITY
47.5/ 100
METRIC RATING
176th/ 347
METRIC RANK
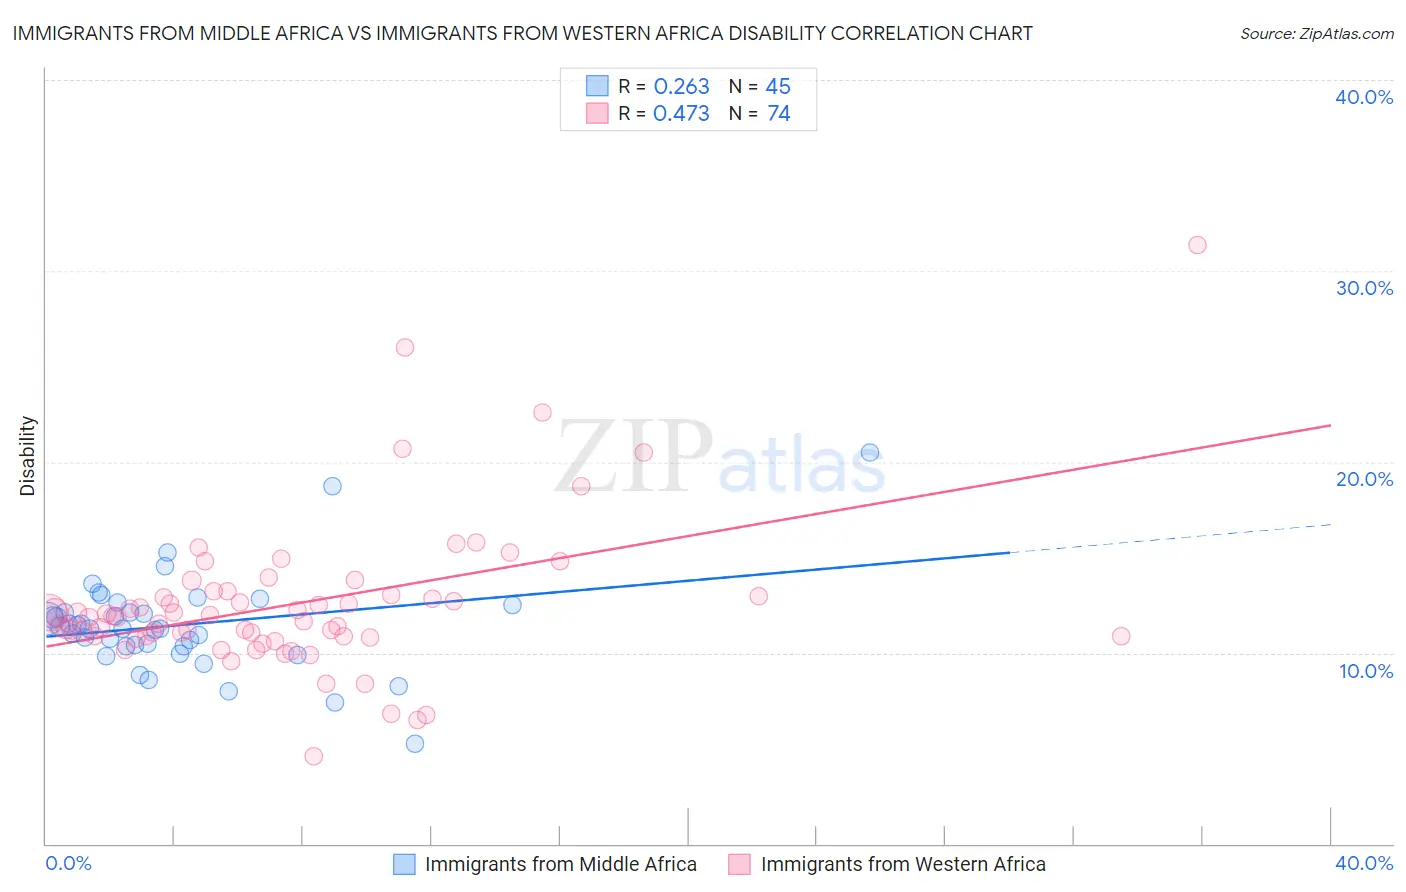
Immigrants from Middle Africa vs Immigrants from Western Africa Disability Correlation Chart
The statistical analysis conducted on geographies consisting of 202,728,715 people shows a weak positive correlation between the proportion of Immigrants from Middle Africa and percentage of population with a disability in the United States with a correlation coefficient (R) of 0.263 and weighted average of 11.6%. Similarly, the statistical analysis conducted on geographies consisting of 357,817,429 people shows a moderate positive correlation between the proportion of Immigrants from Western Africa and percentage of population with a disability in the United States with a correlation coefficient (R) of 0.473 and weighted average of 11.7%, a difference of 1.0%.
Disability Correlation Summary
| Measurement | Immigrants from Middle Africa | Immigrants from Western Africa |
| Minimum | 5.2% | 4.6% |
| Maximum | 20.5% | 31.3% |
| Range | 15.3% | 26.7% |
| Mean | 11.4% | 12.6% |
| Median | 11.3% | 11.9% |
| Interquartile 25% (IQ1) | 10.3% | 10.9% |
| Interquartile 75% (IQ3) | 12.3% | 13.0% |
| Interquartile Range (IQR) | 2.0% | 2.2% |
| Standard Deviation (Sample) | 2.6% | 4.0% |
| Standard Deviation (Population) | 2.5% | 4.0% |
Demographics Similar to Immigrants from Middle Africa and Immigrants from Western Africa by Disability
In terms of disability, the demographic groups most similar to Immigrants from Middle Africa are Immigrants from Fiji (11.6%, a difference of 0.0%), Armenian (11.6%, a difference of 0.18%), Guatemalan (11.6%, a difference of 0.22%), Immigrants from Barbados (11.6%, a difference of 0.26%), and Immigrants from Cuba (11.6%, a difference of 0.33%). Similarly, the demographic groups most similar to Immigrants from Western Africa are Haitian (11.7%, a difference of 0.050%), Albanian (11.7%, a difference of 0.11%), Maltese (11.7%, a difference of 0.14%), Trinidadian and Tobagonian (11.7%, a difference of 0.23%), and Immigrants from Albania (11.7%, a difference of 0.24%).
| Demographics | Rating | Rank | Disability |
| Immigrants | Fiji | 69.5 /100 | #156 | Good 11.6% |
| Immigrants | Middle Africa | 69.5 /100 | #157 | Good 11.6% |
| Armenians | 65.9 /100 | #158 | Good 11.6% |
| Guatemalans | 65.1 /100 | #159 | Good 11.6% |
| Immigrants | Barbados | 64.2 /100 | #160 | Good 11.6% |
| Immigrants | Cuba | 62.8 /100 | #161 | Good 11.6% |
| Immigrants | Haiti | 59.2 /100 | #162 | Average 11.7% |
| Immigrants | Trinidad and Tobago | 58.9 /100 | #163 | Average 11.7% |
| Syrians | 58.5 /100 | #164 | Average 11.7% |
| Cubans | 56.7 /100 | #165 | Average 11.7% |
| Pakistanis | 54.7 /100 | #166 | Average 11.7% |
| Estonians | 54.4 /100 | #167 | Average 11.7% |
| Immigrants | Latin America | 54.1 /100 | #168 | Average 11.7% |
| Immigrants | Austria | 53.4 /100 | #169 | Average 11.7% |
| Immigrants | Albania | 52.8 /100 | #170 | Average 11.7% |
| Immigrants | Southern Europe | 52.8 /100 | #171 | Average 11.7% |
| Trinidadians and Tobagonians | 52.7 /100 | #172 | Average 11.7% |
| Maltese | 50.6 /100 | #173 | Average 11.7% |
| Albanians | 50.0 /100 | #174 | Average 11.7% |
| Haitians | 48.6 /100 | #175 | Average 11.7% |
| Immigrants | Western Africa | 47.5 /100 | #176 | Average 11.7% |