Immigrants from Micronesia vs Basque Female Disability
COMPARE
Immigrants from Micronesia
Basque
Female Disability
Female Disability Comparison
Immigrants from Micronesia
Basques
13.5%
FEMALE DISABILITY
0.0/ 100
METRIC RATING
304th/ 347
METRIC RANK
12.4%
FEMALE DISABILITY
17.5/ 100
METRIC RATING
208th/ 347
METRIC RANK
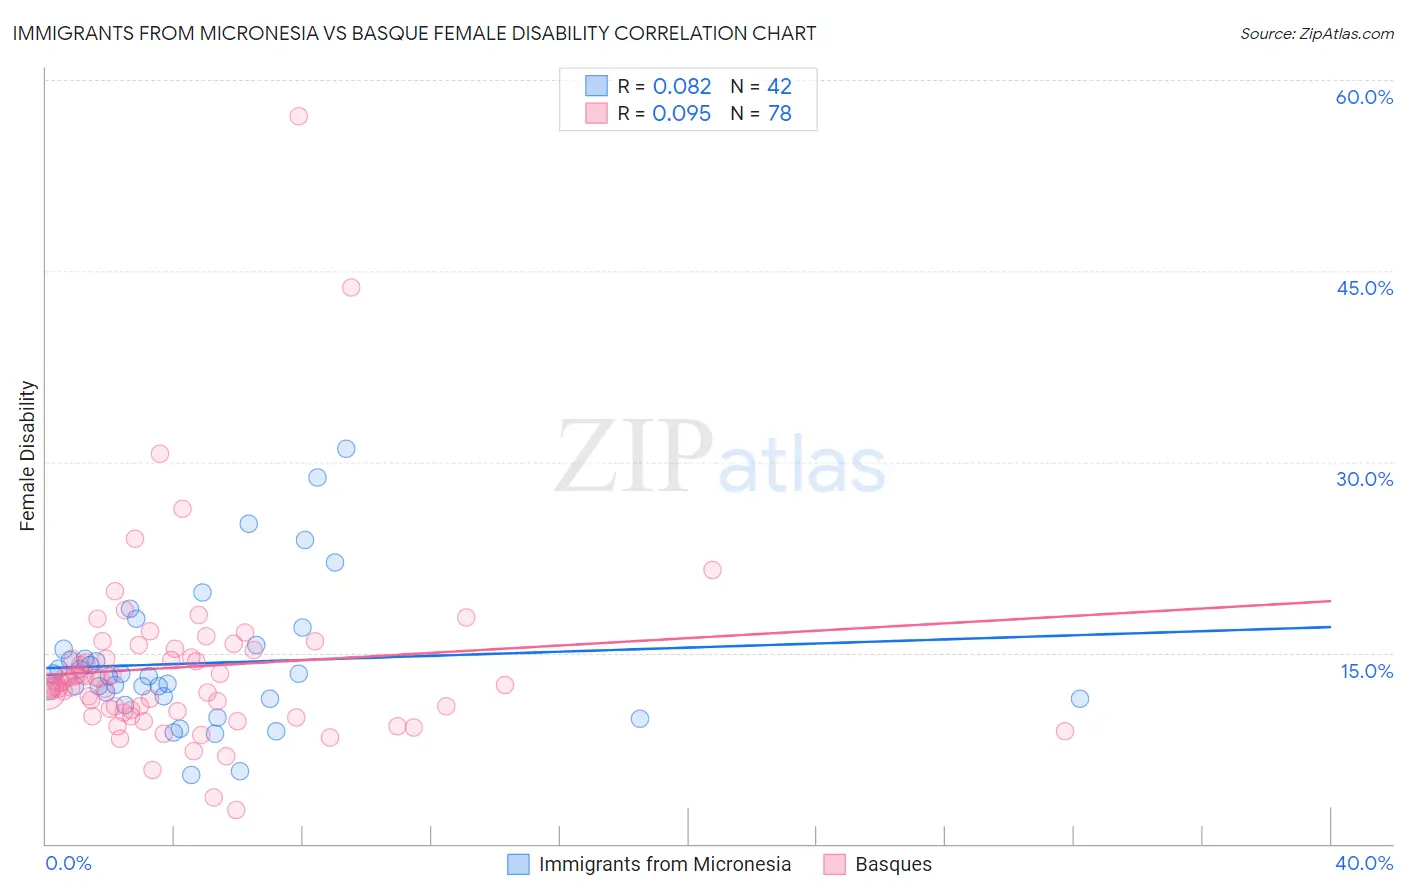
Immigrants from Micronesia vs Basque Female Disability Correlation Chart
The statistical analysis conducted on geographies consisting of 61,603,210 people shows a slight positive correlation between the proportion of Immigrants from Micronesia and percentage of females with a disability in the United States with a correlation coefficient (R) of 0.082 and weighted average of 13.5%. Similarly, the statistical analysis conducted on geographies consisting of 165,775,709 people shows a slight positive correlation between the proportion of Basques and percentage of females with a disability in the United States with a correlation coefficient (R) of 0.095 and weighted average of 12.4%, a difference of 8.7%.
Female Disability Correlation Summary
| Measurement | Immigrants from Micronesia | Basque |
| Minimum | 5.4% | 2.6% |
| Maximum | 31.1% | 57.1% |
| Range | 25.7% | 54.5% |
| Mean | 14.2% | 13.9% |
| Median | 13.2% | 12.6% |
| Interquartile 25% (IQ1) | 11.4% | 10.4% |
| Interquartile 75% (IQ3) | 15.3% | 15.2% |
| Interquartile Range (IQR) | 3.8% | 4.8% |
| Standard Deviation (Sample) | 5.4% | 7.5% |
| Standard Deviation (Population) | 5.4% | 7.4% |
Similar Demographics by Female Disability
Demographics Similar to Immigrants from Micronesia by Female Disability
In terms of female disability, the demographic groups most similar to Immigrants from Micronesia are Scotch-Irish (13.4%, a difference of 0.030%), Immigrants from Portugal (13.5%, a difference of 0.030%), African (13.4%, a difference of 0.17%), Dominican (13.5%, a difference of 0.31%), and Pennsylvania German (13.4%, a difference of 0.37%).
| Demographics | Rating | Rank | Female Disability |
| Slovaks | 0.0 /100 | #297 | Tragic 13.3% |
| Immigrants | Nonimmigrants | 0.0 /100 | #298 | Tragic 13.4% |
| Immigrants | Dominican Republic | 0.0 /100 | #299 | Tragic 13.4% |
| Pennsylvania Germans | 0.0 /100 | #300 | Tragic 13.4% |
| Africans | 0.0 /100 | #301 | Tragic 13.4% |
| Scotch-Irish | 0.0 /100 | #302 | Tragic 13.4% |
| Immigrants | Portugal | 0.0 /100 | #303 | Tragic 13.5% |
| Immigrants | Micronesia | 0.0 /100 | #304 | Tragic 13.5% |
| Dominicans | 0.0 /100 | #305 | Tragic 13.5% |
| French Canadians | 0.0 /100 | #306 | Tragic 13.6% |
| Central American Indians | 0.0 /100 | #307 | Tragic 13.6% |
| Cree | 0.0 /100 | #308 | Tragic 13.7% |
| French American Indians | 0.0 /100 | #309 | Tragic 13.7% |
| Apache | 0.0 /100 | #310 | Tragic 13.7% |
| Hopi | 0.0 /100 | #311 | Tragic 13.7% |
Demographics Similar to Basques by Female Disability
In terms of female disability, the demographic groups most similar to Basques are Mexican (12.4%, a difference of 0.12%), Immigrants from Cuba (12.4%, a difference of 0.16%), Croatian (12.4%, a difference of 0.16%), Immigrants from Grenada (12.4%, a difference of 0.18%), and Swiss (12.4%, a difference of 0.18%).
| Demographics | Rating | Rank | Female Disability |
| Chinese | 22.1 /100 | #201 | Fair 12.3% |
| Somalis | 21.5 /100 | #202 | Fair 12.3% |
| Immigrants | Barbados | 21.1 /100 | #203 | Fair 12.3% |
| Immigrants | Zaire | 20.9 /100 | #204 | Fair 12.3% |
| Immigrants | Grenada | 20.5 /100 | #205 | Fair 12.4% |
| Immigrants | Cuba | 20.2 /100 | #206 | Fair 12.4% |
| Croatians | 20.2 /100 | #207 | Fair 12.4% |
| Basques | 17.5 /100 | #208 | Poor 12.4% |
| Mexicans | 15.7 /100 | #209 | Poor 12.4% |
| Swiss | 14.9 /100 | #210 | Poor 12.4% |
| Immigrants | Bosnia and Herzegovina | 14.8 /100 | #211 | Poor 12.4% |
| Ute | 14.7 /100 | #212 | Poor 12.4% |
| Immigrants | Thailand | 14.5 /100 | #213 | Poor 12.4% |
| Panamanians | 13.5 /100 | #214 | Poor 12.4% |
| Samoans | 13.4 /100 | #215 | Poor 12.4% |