Immigrants from Micronesia vs Immigrants from Canada Female Disability
COMPARE
Immigrants from Micronesia
Immigrants from Canada
Female Disability
Female Disability Comparison
Immigrants from Micronesia
Immigrants from Canada
13.5%
FEMALE DISABILITY
0.0/ 100
METRIC RATING
304th/ 347
METRIC RANK
12.3%
FEMALE DISABILITY
37.2/ 100
METRIC RATING
181st/ 347
METRIC RANK
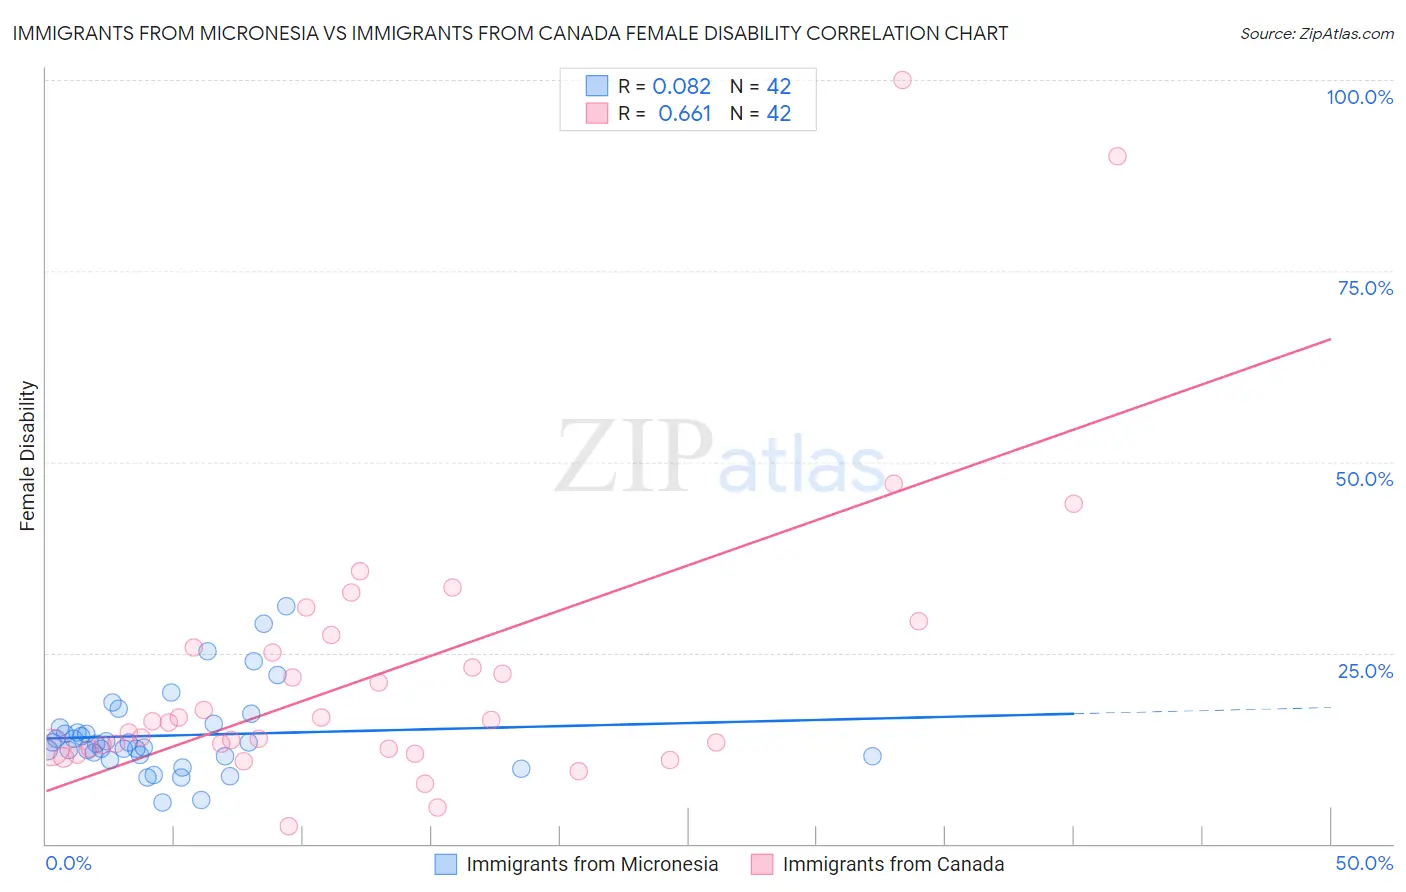
Immigrants from Micronesia vs Immigrants from Canada Female Disability Correlation Chart
The statistical analysis conducted on geographies consisting of 61,603,210 people shows a slight positive correlation between the proportion of Immigrants from Micronesia and percentage of females with a disability in the United States with a correlation coefficient (R) of 0.082 and weighted average of 13.5%. Similarly, the statistical analysis conducted on geographies consisting of 459,343,053 people shows a significant positive correlation between the proportion of Immigrants from Canada and percentage of females with a disability in the United States with a correlation coefficient (R) of 0.661 and weighted average of 12.3%, a difference of 9.8%.
Female Disability Correlation Summary
| Measurement | Immigrants from Micronesia | Immigrants from Canada |
| Minimum | 5.4% | 2.3% |
| Maximum | 31.1% | 100.0% |
| Range | 25.7% | 97.7% |
| Mean | 14.2% | 22.3% |
| Median | 13.2% | 16.0% |
| Interquartile 25% (IQ1) | 11.4% | 12.5% |
| Interquartile 75% (IQ3) | 15.3% | 25.7% |
| Interquartile Range (IQR) | 3.8% | 13.2% |
| Standard Deviation (Sample) | 5.4% | 19.2% |
| Standard Deviation (Population) | 5.4% | 19.0% |
Similar Demographics by Female Disability
Demographics Similar to Immigrants from Micronesia by Female Disability
In terms of female disability, the demographic groups most similar to Immigrants from Micronesia are Scotch-Irish (13.4%, a difference of 0.030%), Immigrants from Portugal (13.5%, a difference of 0.030%), African (13.4%, a difference of 0.17%), Dominican (13.5%, a difference of 0.31%), and Pennsylvania German (13.4%, a difference of 0.37%).
| Demographics | Rating | Rank | Female Disability |
| Slovaks | 0.0 /100 | #297 | Tragic 13.3% |
| Immigrants | Nonimmigrants | 0.0 /100 | #298 | Tragic 13.4% |
| Immigrants | Dominican Republic | 0.0 /100 | #299 | Tragic 13.4% |
| Pennsylvania Germans | 0.0 /100 | #300 | Tragic 13.4% |
| Africans | 0.0 /100 | #301 | Tragic 13.4% |
| Scotch-Irish | 0.0 /100 | #302 | Tragic 13.4% |
| Immigrants | Portugal | 0.0 /100 | #303 | Tragic 13.5% |
| Immigrants | Micronesia | 0.0 /100 | #304 | Tragic 13.5% |
| Dominicans | 0.0 /100 | #305 | Tragic 13.5% |
| French Canadians | 0.0 /100 | #306 | Tragic 13.6% |
| Central American Indians | 0.0 /100 | #307 | Tragic 13.6% |
| Cree | 0.0 /100 | #308 | Tragic 13.7% |
| French American Indians | 0.0 /100 | #309 | Tragic 13.7% |
| Apache | 0.0 /100 | #310 | Tragic 13.7% |
| Hopi | 0.0 /100 | #311 | Tragic 13.7% |
Demographics Similar to Immigrants from Canada by Female Disability
In terms of female disability, the demographic groups most similar to Immigrants from Canada are Norwegian (12.3%, a difference of 0.010%), Albanian (12.3%, a difference of 0.030%), Cuban (12.3%, a difference of 0.030%), Immigrants from Fiji (12.3%, a difference of 0.040%), and Iraqi (12.3%, a difference of 0.050%).
| Demographics | Rating | Rank | Female Disability |
| Immigrants | England | 50.0 /100 | #174 | Average 12.2% |
| Immigrants | St. Vincent and the Grenadines | 49.7 /100 | #175 | Average 12.2% |
| Immigrants | Guyana | 43.1 /100 | #176 | Average 12.2% |
| Immigrants | Ghana | 42.5 /100 | #177 | Average 12.2% |
| Immigrants | Western Europe | 40.9 /100 | #178 | Average 12.2% |
| Immigrants | Fiji | 38.2 /100 | #179 | Fair 12.3% |
| Albanians | 37.9 /100 | #180 | Fair 12.3% |
| Immigrants | Canada | 37.2 /100 | #181 | Fair 12.3% |
| Norwegians | 36.9 /100 | #182 | Fair 12.3% |
| Cubans | 36.5 /100 | #183 | Fair 12.3% |
| Iraqis | 36.0 /100 | #184 | Fair 12.3% |
| Immigrants | Uzbekistan | 33.9 /100 | #185 | Fair 12.3% |
| Austrians | 33.3 /100 | #186 | Fair 12.3% |
| Serbians | 33.1 /100 | #187 | Fair 12.3% |
| Immigrants | North America | 32.8 /100 | #188 | Fair 12.3% |