Asian vs Basque Female Disability
COMPARE
Asian
Basque
Female Disability
Female Disability Comparison
Asians
Basques
10.9%
FEMALE DISABILITY
100.0/ 100
METRIC RATING
21st/ 347
METRIC RANK
12.4%
FEMALE DISABILITY
17.5/ 100
METRIC RATING
208th/ 347
METRIC RANK
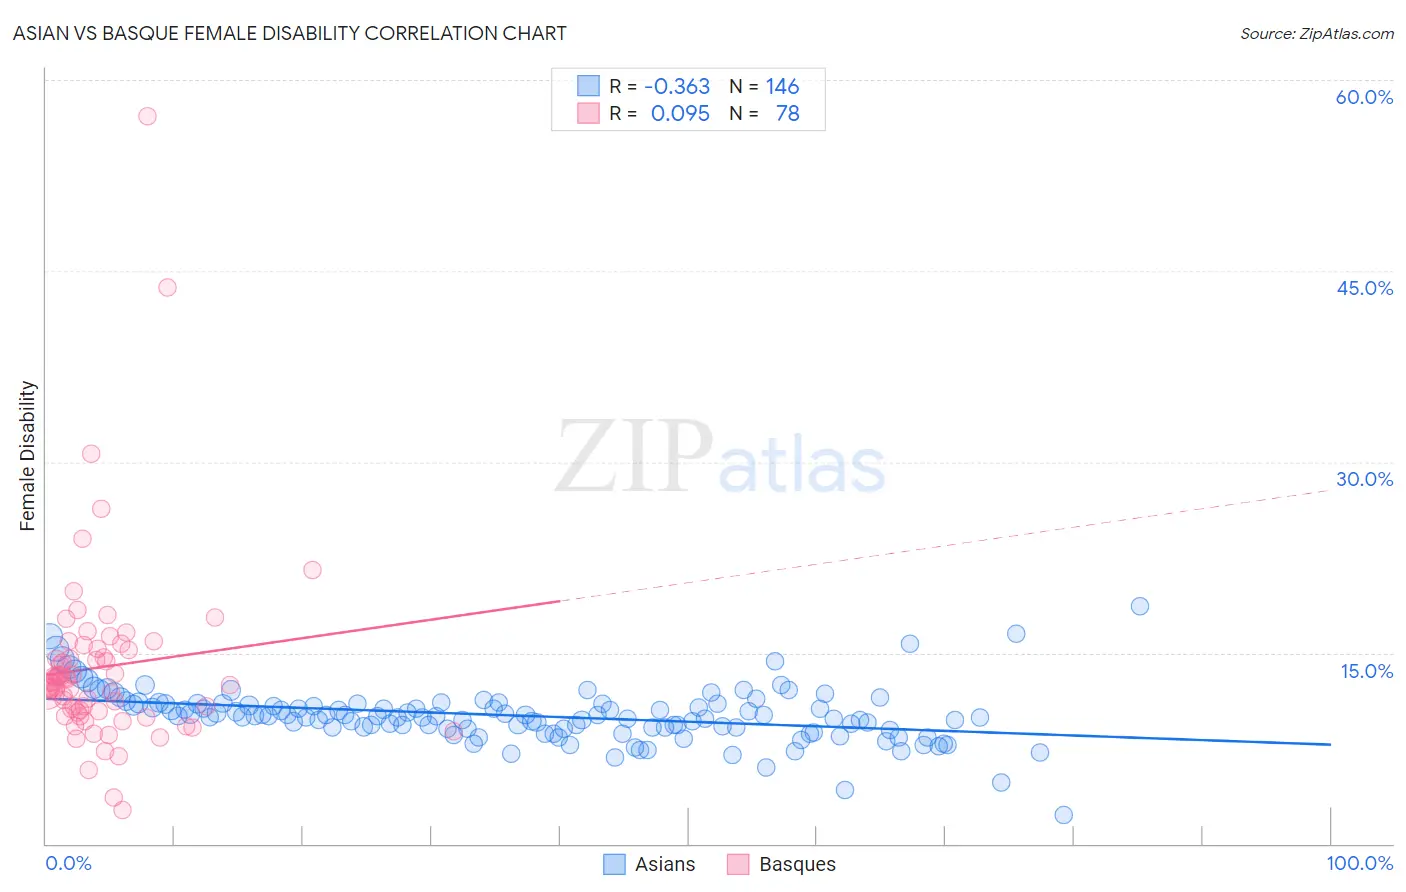
Asian vs Basque Female Disability Correlation Chart
The statistical analysis conducted on geographies consisting of 550,713,500 people shows a mild negative correlation between the proportion of Asians and percentage of females with a disability in the United States with a correlation coefficient (R) of -0.363 and weighted average of 10.9%. Similarly, the statistical analysis conducted on geographies consisting of 165,775,709 people shows a slight positive correlation between the proportion of Basques and percentage of females with a disability in the United States with a correlation coefficient (R) of 0.095 and weighted average of 12.4%, a difference of 13.4%.
Female Disability Correlation Summary
| Measurement | Asian | Basque |
| Minimum | 2.3% | 2.6% |
| Maximum | 18.7% | 57.1% |
| Range | 16.4% | 54.5% |
| Mean | 10.1% | 13.9% |
| Median | 10.0% | 12.6% |
| Interquartile 25% (IQ1) | 9.0% | 10.4% |
| Interquartile 75% (IQ3) | 11.0% | 15.2% |
| Interquartile Range (IQR) | 1.9% | 4.8% |
| Standard Deviation (Sample) | 2.2% | 7.5% |
| Standard Deviation (Population) | 2.1% | 7.4% |
Similar Demographics by Female Disability
Demographics Similar to Asians by Female Disability
In terms of female disability, the demographic groups most similar to Asians are Immigrants from Sri Lanka (10.9%, a difference of 0.13%), Venezuelan (11.0%, a difference of 0.35%), Immigrants from Pakistan (10.9%, a difference of 0.36%), Immigrants from Venezuela (10.9%, a difference of 0.54%), and Immigrants from Iran (10.8%, a difference of 0.75%).
| Demographics | Rating | Rank | Female Disability |
| Immigrants | China | 100.0 /100 | #14 | Exceptional 10.7% |
| Burmese | 100.0 /100 | #15 | Exceptional 10.7% |
| Okinawans | 100.0 /100 | #16 | Exceptional 10.8% |
| Indians (Asian) | 100.0 /100 | #17 | Exceptional 10.8% |
| Immigrants | Iran | 100.0 /100 | #18 | Exceptional 10.8% |
| Immigrants | Venezuela | 100.0 /100 | #19 | Exceptional 10.9% |
| Immigrants | Pakistan | 100.0 /100 | #20 | Exceptional 10.9% |
| Asians | 100.0 /100 | #21 | Exceptional 10.9% |
| Immigrants | Sri Lanka | 100.0 /100 | #22 | Exceptional 10.9% |
| Venezuelans | 100.0 /100 | #23 | Exceptional 11.0% |
| Immigrants | Argentina | 100.0 /100 | #24 | Exceptional 11.0% |
| Immigrants | Asia | 100.0 /100 | #25 | Exceptional 11.0% |
| Argentineans | 100.0 /100 | #26 | Exceptional 11.0% |
| Immigrants | Turkey | 100.0 /100 | #27 | Exceptional 11.1% |
| Egyptians | 100.0 /100 | #28 | Exceptional 11.1% |
Demographics Similar to Basques by Female Disability
In terms of female disability, the demographic groups most similar to Basques are Mexican (12.4%, a difference of 0.12%), Immigrants from Cuba (12.4%, a difference of 0.16%), Croatian (12.4%, a difference of 0.16%), Immigrants from Grenada (12.4%, a difference of 0.18%), and Swiss (12.4%, a difference of 0.18%).
| Demographics | Rating | Rank | Female Disability |
| Chinese | 22.1 /100 | #201 | Fair 12.3% |
| Somalis | 21.5 /100 | #202 | Fair 12.3% |
| Immigrants | Barbados | 21.1 /100 | #203 | Fair 12.3% |
| Immigrants | Zaire | 20.9 /100 | #204 | Fair 12.3% |
| Immigrants | Grenada | 20.5 /100 | #205 | Fair 12.4% |
| Immigrants | Cuba | 20.2 /100 | #206 | Fair 12.4% |
| Croatians | 20.2 /100 | #207 | Fair 12.4% |
| Basques | 17.5 /100 | #208 | Poor 12.4% |
| Mexicans | 15.7 /100 | #209 | Poor 12.4% |
| Swiss | 14.9 /100 | #210 | Poor 12.4% |
| Immigrants | Bosnia and Herzegovina | 14.8 /100 | #211 | Poor 12.4% |
| Ute | 14.7 /100 | #212 | Poor 12.4% |
| Immigrants | Thailand | 14.5 /100 | #213 | Poor 12.4% |
| Panamanians | 13.5 /100 | #214 | Poor 12.4% |
| Samoans | 13.4 /100 | #215 | Poor 12.4% |