Immigrants from Caribbean vs Basque Female Disability
COMPARE
Immigrants from Caribbean
Basque
Female Disability
Female Disability Comparison
Immigrants from Caribbean
Basques
12.7%
FEMALE DISABILITY
1.4/ 100
METRIC RATING
252nd/ 347
METRIC RANK
12.4%
FEMALE DISABILITY
17.5/ 100
METRIC RATING
208th/ 347
METRIC RANK
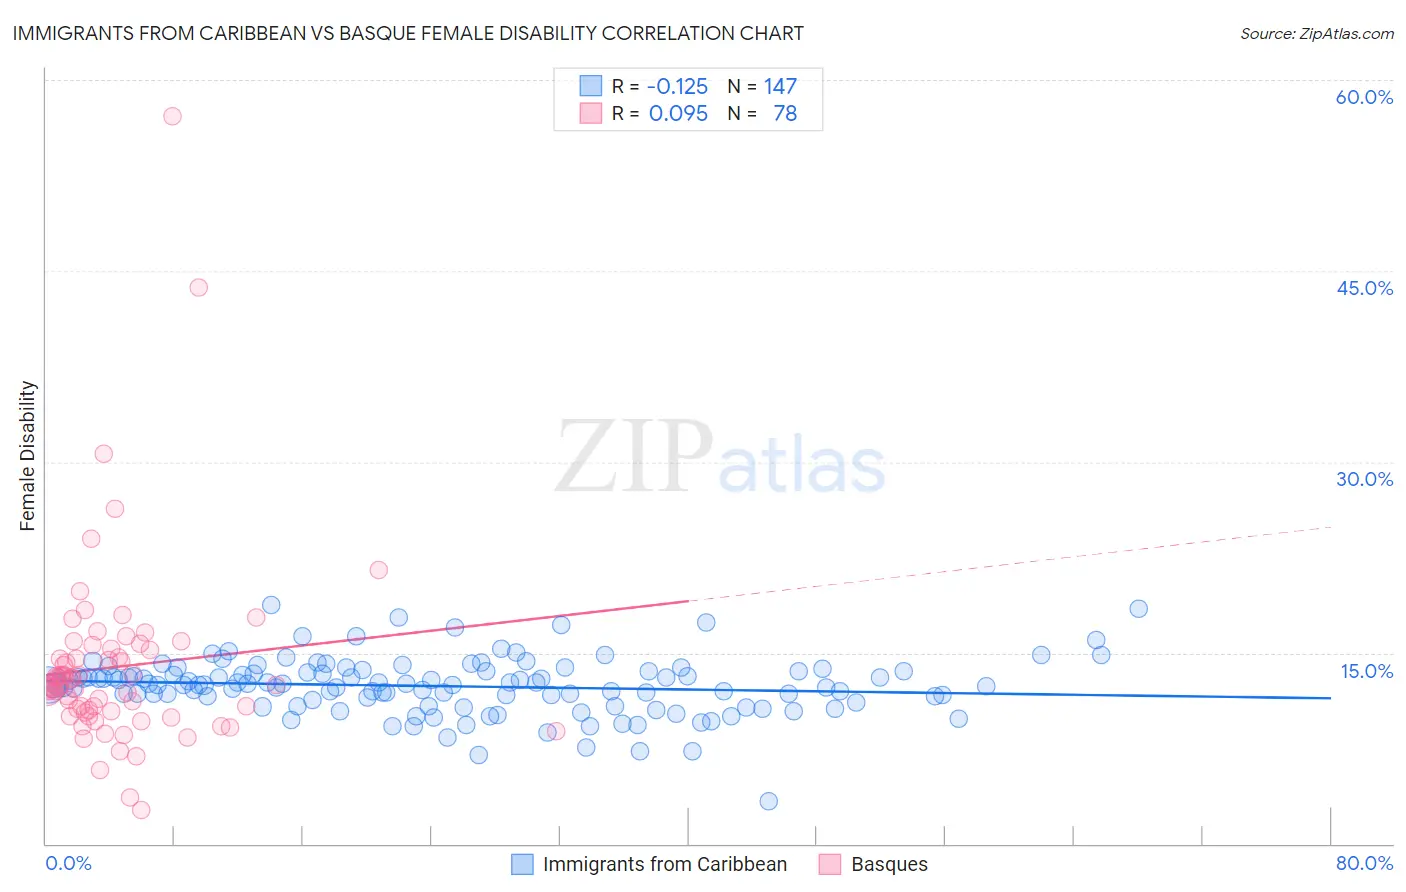
Immigrants from Caribbean vs Basque Female Disability Correlation Chart
The statistical analysis conducted on geographies consisting of 449,918,897 people shows a poor negative correlation between the proportion of Immigrants from Caribbean and percentage of females with a disability in the United States with a correlation coefficient (R) of -0.125 and weighted average of 12.7%. Similarly, the statistical analysis conducted on geographies consisting of 165,775,709 people shows a slight positive correlation between the proportion of Basques and percentage of females with a disability in the United States with a correlation coefficient (R) of 0.095 and weighted average of 12.4%, a difference of 2.5%.
Female Disability Correlation Summary
| Measurement | Immigrants from Caribbean | Basque |
| Minimum | 3.3% | 2.6% |
| Maximum | 18.7% | 57.1% |
| Range | 15.4% | 54.5% |
| Mean | 12.4% | 13.9% |
| Median | 12.5% | 12.6% |
| Interquartile 25% (IQ1) | 11.3% | 10.4% |
| Interquartile 75% (IQ3) | 13.5% | 15.2% |
| Interquartile Range (IQR) | 2.3% | 4.8% |
| Standard Deviation (Sample) | 2.2% | 7.5% |
| Standard Deviation (Population) | 2.2% | 7.4% |
Similar Demographics by Female Disability
Demographics Similar to Immigrants from Caribbean by Female Disability
In terms of female disability, the demographic groups most similar to Immigrants from Caribbean are Jamaican (12.7%, a difference of 0.010%), Hawaiian (12.7%, a difference of 0.040%), Crow (12.7%, a difference of 0.080%), Immigrants from Germany (12.7%, a difference of 0.12%), and Slovene (12.7%, a difference of 0.14%).
| Demographics | Rating | Rank | Female Disability |
| Immigrants | Jamaica | 2.2 /100 | #245 | Tragic 12.6% |
| Spanish American Indians | 2.1 /100 | #246 | Tragic 12.6% |
| Menominee | 2.1 /100 | #247 | Tragic 12.6% |
| Carpatho Rusyns | 2.0 /100 | #248 | Tragic 12.6% |
| Immigrants | Congo | 1.8 /100 | #249 | Tragic 12.7% |
| Slovenes | 1.7 /100 | #250 | Tragic 12.7% |
| Crow | 1.6 /100 | #251 | Tragic 12.7% |
| Immigrants | Caribbean | 1.4 /100 | #252 | Tragic 12.7% |
| Jamaicans | 1.4 /100 | #253 | Tragic 12.7% |
| Hawaiians | 1.4 /100 | #254 | Tragic 12.7% |
| Immigrants | Germany | 1.3 /100 | #255 | Tragic 12.7% |
| British West Indians | 1.2 /100 | #256 | Tragic 12.7% |
| Liberians | 1.1 /100 | #257 | Tragic 12.7% |
| Aleuts | 1.1 /100 | #258 | Tragic 12.7% |
| Immigrants | Armenia | 1.0 /100 | #259 | Tragic 12.7% |
Demographics Similar to Basques by Female Disability
In terms of female disability, the demographic groups most similar to Basques are Mexican (12.4%, a difference of 0.12%), Immigrants from Cuba (12.4%, a difference of 0.16%), Croatian (12.4%, a difference of 0.16%), Immigrants from Grenada (12.4%, a difference of 0.18%), and Swiss (12.4%, a difference of 0.18%).
| Demographics | Rating | Rank | Female Disability |
| Chinese | 22.1 /100 | #201 | Fair 12.3% |
| Somalis | 21.5 /100 | #202 | Fair 12.3% |
| Immigrants | Barbados | 21.1 /100 | #203 | Fair 12.3% |
| Immigrants | Zaire | 20.9 /100 | #204 | Fair 12.3% |
| Immigrants | Grenada | 20.5 /100 | #205 | Fair 12.4% |
| Immigrants | Cuba | 20.2 /100 | #206 | Fair 12.4% |
| Croatians | 20.2 /100 | #207 | Fair 12.4% |
| Basques | 17.5 /100 | #208 | Poor 12.4% |
| Mexicans | 15.7 /100 | #209 | Poor 12.4% |
| Swiss | 14.9 /100 | #210 | Poor 12.4% |
| Immigrants | Bosnia and Herzegovina | 14.8 /100 | #211 | Poor 12.4% |
| Ute | 14.7 /100 | #212 | Poor 12.4% |
| Immigrants | Thailand | 14.5 /100 | #213 | Poor 12.4% |
| Panamanians | 13.5 /100 | #214 | Poor 12.4% |
| Samoans | 13.4 /100 | #215 | Poor 12.4% |