Lithuanian vs Alaska Native Cognitive Disability
COMPARE
Lithuanian
Alaska Native
Cognitive Disability
Cognitive Disability Comparison
Lithuanians
Alaska Natives
16.3%
COGNITIVE DISABILITY
100.0/ 100
METRIC RATING
13th/ 347
METRIC RANK
17.5%
COGNITIVE DISABILITY
10.4/ 100
METRIC RATING
206th/ 347
METRIC RANK
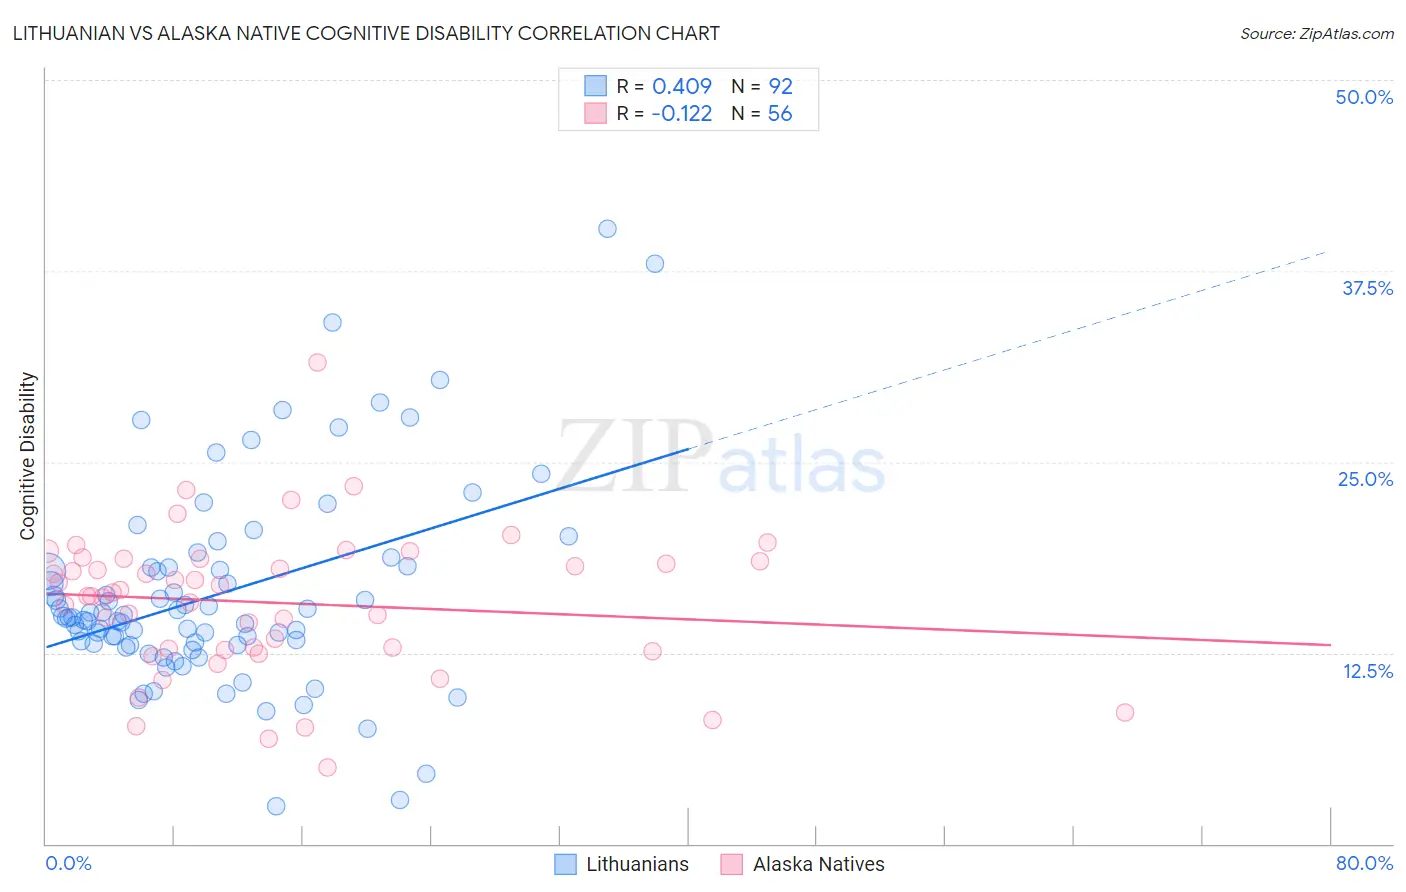
Lithuanian vs Alaska Native Cognitive Disability Correlation Chart
The statistical analysis conducted on geographies consisting of 421,943,876 people shows a moderate positive correlation between the proportion of Lithuanians and percentage of population with cognitive disability in the United States with a correlation coefficient (R) of 0.409 and weighted average of 16.3%. Similarly, the statistical analysis conducted on geographies consisting of 76,778,470 people shows a poor negative correlation between the proportion of Alaska Natives and percentage of population with cognitive disability in the United States with a correlation coefficient (R) of -0.122 and weighted average of 17.5%, a difference of 7.9%.
Cognitive Disability Correlation Summary
| Measurement | Lithuanian | Alaska Native |
| Minimum | 2.5% | 5.0% |
| Maximum | 40.3% | 31.5% |
| Range | 37.8% | 26.5% |
| Mean | 16.3% | 15.8% |
| Median | 14.8% | 16.3% |
| Interquartile 25% (IQ1) | 13.1% | 12.7% |
| Interquartile 75% (IQ3) | 18.1% | 18.6% |
| Interquartile Range (IQR) | 5.0% | 5.9% |
| Standard Deviation (Sample) | 6.6% | 4.7% |
| Standard Deviation (Population) | 6.6% | 4.7% |
Similar Demographics by Cognitive Disability
Demographics Similar to Lithuanians by Cognitive Disability
In terms of cognitive disability, the demographic groups most similar to Lithuanians are Immigrants from Austria (16.3%, a difference of 0.060%), Maltese (16.2%, a difference of 0.090%), Immigrants from Greece (16.3%, a difference of 0.090%), Immigrants from Czechoslovakia (16.2%, a difference of 0.25%), and Immigrants from Scotland (16.2%, a difference of 0.34%).
| Demographics | Rating | Rank | Cognitive Disability |
| Thais | 100.0 /100 | #6 | Exceptional 16.1% |
| Immigrants | Ireland | 100.0 /100 | #7 | Exceptional 16.1% |
| Immigrants | Poland | 100.0 /100 | #8 | Exceptional 16.1% |
| Assyrians/Chaldeans/Syriacs | 100.0 /100 | #9 | Exceptional 16.2% |
| Immigrants | Scotland | 100.0 /100 | #10 | Exceptional 16.2% |
| Immigrants | Czechoslovakia | 100.0 /100 | #11 | Exceptional 16.2% |
| Maltese | 100.0 /100 | #12 | Exceptional 16.2% |
| Lithuanians | 100.0 /100 | #13 | Exceptional 16.3% |
| Immigrants | Austria | 100.0 /100 | #14 | Exceptional 16.3% |
| Immigrants | Greece | 100.0 /100 | #15 | Exceptional 16.3% |
| Eastern Europeans | 100.0 /100 | #16 | Exceptional 16.3% |
| Immigrants | North Macedonia | 100.0 /100 | #17 | Exceptional 16.3% |
| Immigrants | Northern Europe | 100.0 /100 | #18 | Exceptional 16.3% |
| Immigrants | Bolivia | 100.0 /100 | #19 | Exceptional 16.3% |
| Bulgarians | 100.0 /100 | #20 | Exceptional 16.3% |
Demographics Similar to Alaska Natives by Cognitive Disability
In terms of cognitive disability, the demographic groups most similar to Alaska Natives are Immigrants from Zimbabwe (17.5%, a difference of 0.040%), Puget Sound Salish (17.5%, a difference of 0.040%), Immigrants from Caribbean (17.5%, a difference of 0.050%), Immigrants from Latin America (17.6%, a difference of 0.050%), and Immigrants from Cameroon (17.6%, a difference of 0.090%).
| Demographics | Rating | Rank | Cognitive Disability |
| Immigrants | Singapore | 14.3 /100 | #199 | Poor 17.5% |
| Haitians | 14.1 /100 | #200 | Poor 17.5% |
| South American Indians | 13.0 /100 | #201 | Poor 17.5% |
| Immigrants | Morocco | 12.0 /100 | #202 | Poor 17.5% |
| Immigrants | Caribbean | 11.0 /100 | #203 | Poor 17.5% |
| Immigrants | Zimbabwe | 11.0 /100 | #204 | Poor 17.5% |
| Puget Sound Salish | 10.9 /100 | #205 | Poor 17.5% |
| Alaska Natives | 10.4 /100 | #206 | Poor 17.5% |
| Immigrants | Latin America | 9.7 /100 | #207 | Tragic 17.6% |
| Immigrants | Cameroon | 9.3 /100 | #208 | Tragic 17.6% |
| Immigrants | Trinidad and Tobago | 8.7 /100 | #209 | Tragic 17.6% |
| Immigrants | Jamaica | 8.5 /100 | #210 | Tragic 17.6% |
| Taiwanese | 7.7 /100 | #211 | Tragic 17.6% |
| Immigrants | Oceania | 7.3 /100 | #212 | Tragic 17.6% |
| Hawaiians | 7.2 /100 | #213 | Tragic 17.6% |