Immigrants from Malaysia vs Apache Cognitive Disability

COMPARE

Immigrants from Malaysia
Race
Ancestry
AfghanAfricanAlaska NativeAlaskan AthabascanAlbanianAleutAlsatianAmericanArabArapahoArgentineanArmenianAssyrian/Chaldean/SyriacAustralianAustrianBahamianBangladeshiBarbadianBasqueBelgianBelizeanBermudanBhutaneseBlackfeetBolivianBrazilianBritishBritish West IndianBulgarianBurmeseCajunCambodianCanadianCape VerdeanCarpatho RusynCelticCentral AmericanCentral American IndianCherokeeCheyenneChickasawChileanChineseChippewaChoctawColombianColvilleComancheCosta RicanCreeCreekCroatianCrowCubanCypriotCzechCzechoslovakianDanishDelawareDominicanDutchDutch West IndianEastern EuropeanEcuadorianEgyptianEnglishEstonianEthiopianEuropeanFijianFilipinoFinnishFrenchFrench American IndianFrench CanadianGermanGerman RussianGhanaianGreekGuamanian/ChamorroGuatemalanGuyaneseHaitianHmongHonduranHopiHoumaHungarianIcelanderIndian (Asian)IndonesianInupiatIranianIraqiIrishIroquoisIsraeliItalianJamaicanJapaneseJordanianKenyanKiowaKoreanLaotianLatvianLebaneseLiberianLithuanianLumbeeLuxembourgerMacedonianMalaysianMalteseMarshalleseMenomineeMexicanMexican American IndianMongolianMoroccanNative HawaiianNavajoNepaleseNew ZealanderNicaraguanNigerianNorthern EuropeanNorwegianOkinawanOsageOttawaPaiutePakistaniPalestinianPanamanianParaguayanPennsylvania GermanPeruvianPimaPolishPortuguesePotawatomiPuebloPuerto RicanPuget Sound SalishRomanianRussianSalvadoranSamoanScandinavianScotch-IrishScottishSeminoleSenegaleseSerbianShoshoneSierra LeoneanSiouxSlavicSlovakSloveneSomaliSouth AfricanSouth AmericanSouth American IndianSoviet UnionSpaniardSpanishSpanish AmericanSpanish American IndianSri LankanSubsaharan AfricanSudaneseSwedishSwissSyrianTaiwaneseThaiTlingit-HaidaTohono O'OdhamTonganTrinidadian and TobagonianTsimshianTurkishU.S. Virgin IslanderUgandanUkrainianUruguayanUteVenezuelanVietnameseWelshWest IndianYakamaYaquiYugoslavianYumanYup'ikZimbabwean
Immigration
NonimmigrantsImmigrantsAfghanistanAfricaAlbaniaArgentinaArmeniaAsiaAustraliaAustriaBahamasBangladeshBarbadosBelarusBelgiumBelizeBoliviaBosnia and HerzegovinaBrazilBulgariaBurma/MyanmarCabo VerdeCambodiaCameroonCanadaCaribbeanCentral AmericaChileChinaColombiaCongoCosta RicaCroatiaCubaCzechoslovakiaDenmarkDominicaDominican RepublicEastern AfricaEastern AsiaEastern EuropeEcuadorEgyptEl SalvadorEnglandEritreaEthiopiaEuropeFijiFranceGermanyGhanaGreeceGrenadaGuatemalaGuyanaHaitiHondurasHong KongHungaryIndiaIndonesiaIranIraqIrelandIsraelItalyJamaicaJapanJordanKazakhstanKenyaKoreaKuwaitLaosLatin AmericaLatviaLebanonLiberiaLithuaniaMalaysiaMexicoMicronesiaMiddle AfricaMoldovaMoroccoNepalNetherlandsNicaraguaNigeriaNorth AmericaNorth MacedoniaNorthern AfricaNorthern EuropeNorwayOceaniaPakistanPanamaPeruPhilippinesPolandPortugalRomaniaRussiaSaudi ArabiaScotlandSenegalSerbiaSierra LeoneSingaporeSomaliaSouth AfricaSouth AmericaSouth Central AsiaSouth Eastern AsiaSouthern EuropeSpainSri LankaSt. Vincent and the GrenadinesSudanSwedenSwitzerlandSyriaTaiwanThailandTrinidad and TobagoTurkeyUgandaUkraineUruguayUzbekistanVenezuelaVietnamWest IndiesWestern AfricaWestern AsiaWestern EuropeYemenZaireZimbabweAzores
Apache
Race
Ancestry
AfghanAfricanAlaska NativeAlaskan AthabascanAlbanianAleutAlsatianAmericanApacheArabArapahoArgentineanArmenianAssyrian/Chaldean/SyriacAustralianAustrianBahamianBangladeshiBarbadianBasqueBelgianBelizeanBermudanBhutaneseBlackfeetBolivianBrazilianBritishBritish West IndianBulgarianBurmeseCajunCambodianCanadianCape VerdeanCarpatho RusynCelticCentral AmericanCentral American IndianCherokeeCheyenneChickasawChileanChineseChippewaChoctawColombianColvilleComancheCosta RicanCreeCreekCroatianCrowCubanCypriotCzechCzechoslovakianDanishDelawareDominicanDutchDutch West IndianEastern EuropeanEcuadorianEgyptianEnglishEstonianEthiopianEuropeanFijianFilipinoFinnishFrenchFrench American IndianFrench CanadianGermanGerman RussianGhanaianGreekGuamanian/ChamorroGuatemalanGuyaneseHaitianHmongHonduranHopiHoumaHungarianIcelanderIndian (Asian)IndonesianInupiatIranianIraqiIrishIroquoisIsraeliItalianJamaicanJapaneseJordanianKenyanKiowaKoreanLaotianLatvianLebaneseLiberianLithuanianLumbeeLuxembourgerMacedonianMalaysianMalteseMarshalleseMenomineeMexicanMexican American IndianMongolianMoroccanNative HawaiianNavajoNepaleseNew ZealanderNicaraguanNigerianNorthern EuropeanNorwegianOkinawanOsageOttawaPaiutePakistaniPalestinianPanamanianParaguayanPennsylvania GermanPeruvianPimaPolishPortuguesePotawatomiPuebloPuerto RicanPuget Sound SalishRomanianRussianSalvadoranSamoanScandinavianScotch-IrishScottishSeminoleSenegaleseSerbianShoshoneSierra LeoneanSiouxSlavicSlovakSloveneSomaliSouth AfricanSouth AmericanSouth American IndianSoviet UnionSpaniardSpanishSpanish AmericanSpanish American IndianSri LankanSubsaharan AfricanSudaneseSwedishSwissSyrianTaiwaneseThaiTlingit-HaidaTohono O'OdhamTonganTrinidadian and TobagonianTsimshianTurkishU.S. Virgin IslanderUgandanUkrainianUruguayanUteVenezuelanVietnameseWelshWest IndianYakamaYaquiYugoslavianYumanYup'ikZimbabwean
Immigration
NonimmigrantsImmigrantsAfghanistanAfricaAlbaniaArgentinaArmeniaAsiaAustraliaAustriaBahamasBangladeshBarbadosBelarusBelgiumBelizeBoliviaBosnia and HerzegovinaBrazilBulgariaBurma/MyanmarCabo VerdeCambodiaCameroonCanadaCaribbeanCentral AmericaChileChinaColombiaCongoCosta RicaCroatiaCubaCzechoslovakiaDenmarkDominicaDominican RepublicEastern AfricaEastern AsiaEastern EuropeEcuadorEgyptEl SalvadorEnglandEritreaEthiopiaEuropeFijiFranceGermanyGhanaGreeceGrenadaGuatemalaGuyanaHaitiHondurasHong KongHungaryIndiaIndonesiaIranIraqIrelandIsraelItalyJamaicaJapanJordanKazakhstanKenyaKoreaKuwaitLaosLatin AmericaLatviaLebanonLiberiaLithuaniaMexicoMicronesiaMiddle AfricaMoldovaMoroccoNepalNetherlandsNicaraguaNigeriaNorth AmericaNorth MacedoniaNorthern AfricaNorthern EuropeNorwayOceaniaPakistanPanamaPeruPhilippinesPolandPortugalRomaniaRussiaSaudi ArabiaScotlandSenegalSerbiaSierra LeoneSingaporeSomaliaSouth AfricaSouth AmericaSouth Central AsiaSouth Eastern AsiaSouthern EuropeSpainSri LankaSt. Vincent and the GrenadinesSudanSwedenSwitzerlandSyriaTaiwanThailandTrinidad and TobagoTurkeyUgandaUkraineUruguayUzbekistanVenezuelaVietnamWest IndiesWestern AfricaWestern AsiaWestern EuropeYemenZaireZimbabweAzores
Cognitive Disability
Income
Poverty
Unemployment
Labor Participation
Family Structure
Vehicle Availability
Education Level
Disability

Cognitive Disability Comparison

Immigrants from Malaysia

Apache

Good
Tragic
17.1%
COGNITIVE DISABILITY
79.3/ 100
METRIC RATING
154th/ 347
METRIC RANK
18.6%
COGNITIVE DISABILITY
0.0/ 100
METRIC RATING
320th/ 347
METRIC RANK

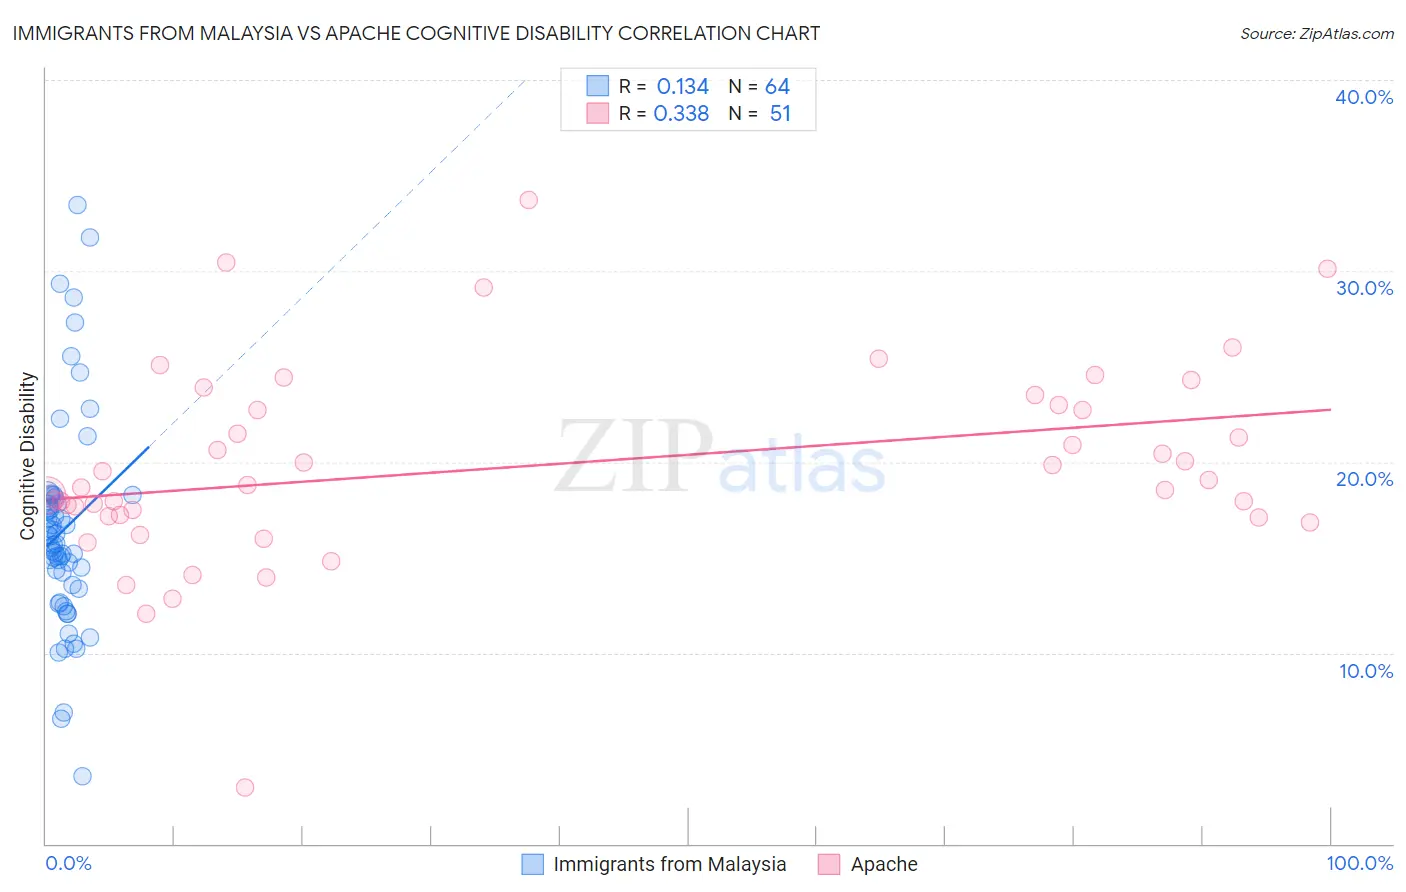
Immigrants from Malaysia vs Apache Cognitive Disability Correlation Chart

The statistical analysis conducted on geographies consisting of 197,973,854 people shows a poor positive correlation between the proportion of Immigrants from Malaysia and percentage of population with cognitive disability in the United States with a correlation coefficient (R) of 0.134 and weighted average of 17.1%. Similarly, the statistical analysis conducted on geographies consisting of 231,073,406 people shows a mild positive correlation between the proportion of Apache and percentage of population with cognitive disability in the United States with a correlation coefficient (R) of 0.338 and weighted average of 18.6%, a difference of 8.8%.
Immigrants from Malaysia vs Apache Cognitive Disability

Cognitive Disability Correlation Summary

MeasurementImmigrants from MalaysiaApache
Minimum3.5%2.9%
Maximum33.4%33.7%
Range29.9%30.8%
Mean16.4%19.8%
Median15.7%18.8%
Interquartile 25% (IQ1)13.4%17.2%
Interquartile 75% (IQ3)18.0%23.0%
Interquartile Range (IQR)4.6%5.8%
Standard Deviation (Sample)5.6%5.2%
Standard Deviation (Population)5.5%5.2%

Similar Demographics by Cognitive Disability

Demographics Similar to Immigrants from Malaysia by Cognitive Disability

In terms of cognitive disability, the demographic groups most similar to Immigrants from Malaysia are Brazilian (17.1%, a difference of 0.020%), Sri Lankan (17.1%, a difference of 0.020%), Immigrants from Kazakhstan (17.1%, a difference of 0.050%), Immigrants from Australia (17.1%, a difference of 0.14%), and Immigrants from Indonesia (17.1%, a difference of 0.16%).
DemographicsRating | RankCognitive Disability
Scotch-Irish
85.9
/100
|
#147
Excellent
17.1%
French Canadians
85.7
/100
|
#148
Excellent
17.1%
Cypriots
85.7
/100
|
#149
Excellent
17.1%
Basques
85.5
/100
|
#150
Excellent
17.1%
Syrians
83.0
/100
|
#151
Excellent
17.1%
Immigrants | Indonesia
82.7
/100
|
#152
Excellent
17.1%
Immigrants | Kazakhstan
80.5
/100
|
#153
Excellent
17.1%
Immigrants | Malaysia
79.3
/100
|
#154
Good
17.1%
Brazilians
78.9
/100
|
#155
Good
17.1%
Sri Lankans
78.9
/100
|
#156
Good
17.1%
Immigrants | Australia
76.0
/100
|
#157
Good
17.1%
Celtics
74.1
/100
|
#158
Good
17.1%
Immigrants | Latvia
73.2
/100
|
#159
Good
17.2%
Australians
72.4
/100
|
#160
Good
17.2%
Americans
72.2
/100
|
#161
Good
17.2%

Demographics Similar to Apache by Cognitive Disability

In terms of cognitive disability, the demographic groups most similar to Apache are Comanche (18.6%, a difference of 0.040%), Bangladeshi (18.6%, a difference of 0.080%), African (18.6%, a difference of 0.090%), Immigrants from Liberia (18.7%, a difference of 0.16%), and Pueblo (18.7%, a difference of 0.17%).
DemographicsRating | RankCognitive Disability
Yaqui
0.0
/100
|
#313
Tragic
18.5%
Sub-Saharan Africans
0.0
/100
|
#314
Tragic
18.5%
Immigrants | Dominica
0.0
/100
|
#315
Tragic
18.6%
Immigrants | Middle Africa
0.0
/100
|
#316
Tragic
18.6%
Liberians
0.0
/100
|
#317
Tragic
18.6%
Bangladeshis
0.0
/100
|
#318
Tragic
18.6%
Comanche
0.0
/100
|
#319
Tragic
18.6%
Apache
0.0
/100
|
#320
Tragic
18.6%
Africans
0.0
/100
|
#321
Tragic
18.6%
Immigrants | Liberia
0.0
/100
|
#322
Tragic
18.7%
Pueblo
0.0
/100
|
#323
Tragic
18.7%
Dominicans
0.0
/100
|
#324
Tragic
18.7%
Indonesians
0.0
/100
|
#325
Tragic
18.7%
Immigrants | Senegal
0.0
/100
|
#326
Tragic
18.7%
U.S. Virgin Islanders
0.0
/100
|
#327
Tragic
18.7%