Immigrants from Lebanon vs Argentinean Vision Disability
COMPARE
Immigrants from Lebanon
Argentinean
Vision Disability
Vision Disability Comparison
Immigrants from Lebanon
Argentineans
2.1%
VISION DISABILITY
96.7/ 100
METRIC RATING
90th/ 347
METRIC RANK
2.0%
VISION DISABILITY
99.1/ 100
METRIC RATING
59th/ 347
METRIC RANK
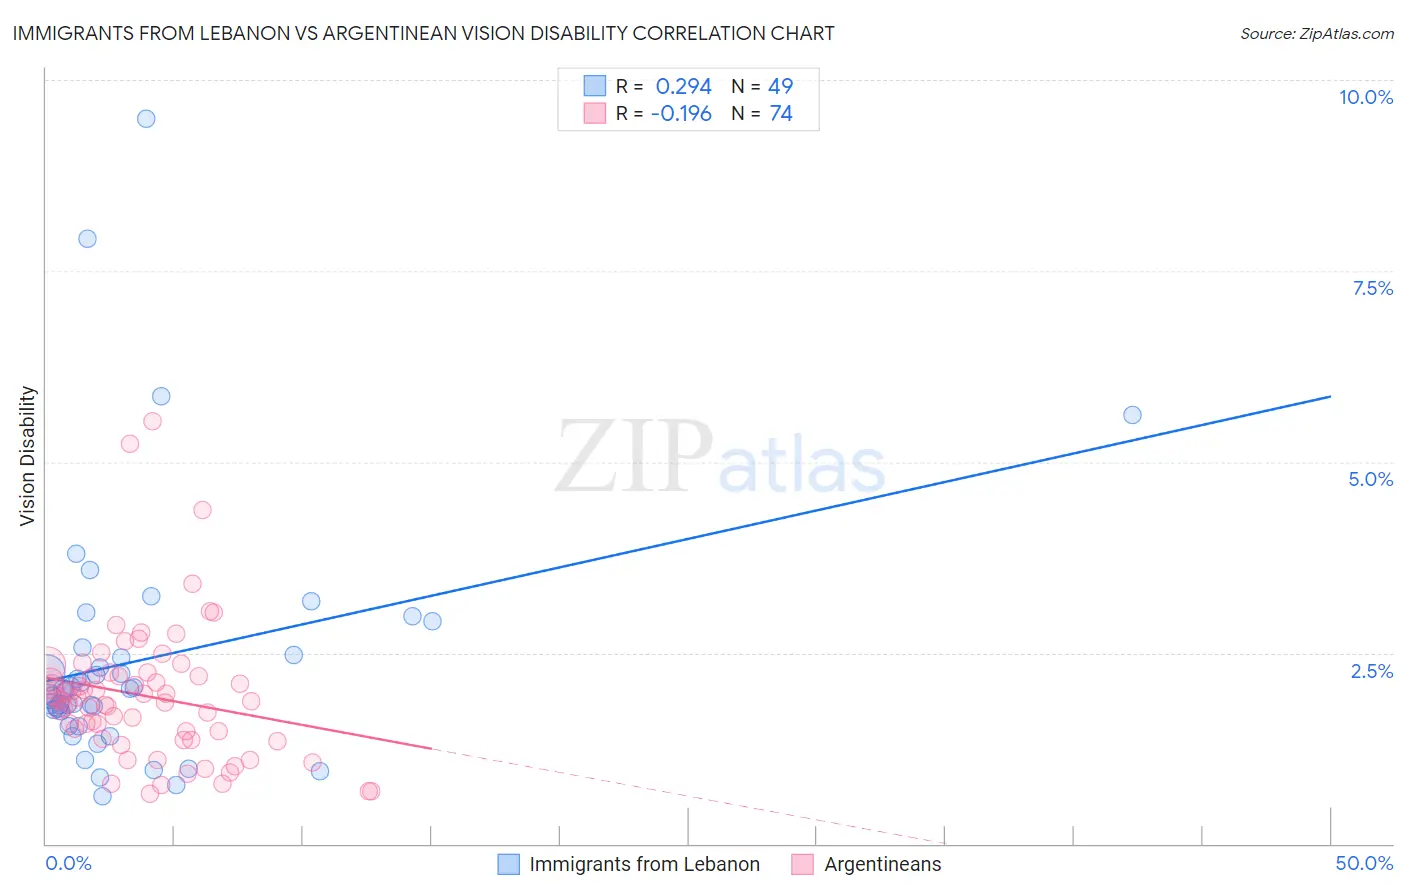
Immigrants from Lebanon vs Argentinean Vision Disability Correlation Chart
The statistical analysis conducted on geographies consisting of 217,113,060 people shows a weak positive correlation between the proportion of Immigrants from Lebanon and percentage of population with vision disability in the United States with a correlation coefficient (R) of 0.294 and weighted average of 2.1%. Similarly, the statistical analysis conducted on geographies consisting of 297,071,793 people shows a poor negative correlation between the proportion of Argentineans and percentage of population with vision disability in the United States with a correlation coefficient (R) of -0.196 and weighted average of 2.0%, a difference of 2.3%.
Vision Disability Correlation Summary
| Measurement | Immigrants from Lebanon | Argentinean |
| Minimum | 0.62% | 0.66% |
| Maximum | 9.5% | 5.5% |
| Range | 8.9% | 4.9% |
| Mean | 2.4% | 1.9% |
| Median | 2.0% | 1.9% |
| Interquartile 25% (IQ1) | 1.6% | 1.4% |
| Interquartile 75% (IQ3) | 2.5% | 2.2% |
| Interquartile Range (IQR) | 0.88% | 0.82% |
| Standard Deviation (Sample) | 1.7% | 0.89% |
| Standard Deviation (Population) | 1.7% | 0.89% |
Similar Demographics by Vision Disability
Demographics Similar to Immigrants from Lebanon by Vision Disability
In terms of vision disability, the demographic groups most similar to Immigrants from Lebanon are Immigrants from Eastern Africa (2.0%, a difference of 0.14%), Norwegian (2.0%, a difference of 0.18%), Immigrants from Switzerland (2.0%, a difference of 0.19%), Immigrants from Somalia (2.1%, a difference of 0.23%), and Immigrants from Syria (2.1%, a difference of 0.24%).
| Demographics | Rating | Rank | Vision Disability |
| Immigrants | Western Asia | 97.5 /100 | #83 | Exceptional 2.0% |
| Immigrants | Latvia | 97.3 /100 | #84 | Exceptional 2.0% |
| Chinese | 97.2 /100 | #85 | Exceptional 2.0% |
| Immigrants | Moldova | 97.2 /100 | #86 | Exceptional 2.0% |
| Immigrants | Switzerland | 97.0 /100 | #87 | Exceptional 2.0% |
| Norwegians | 97.0 /100 | #88 | Exceptional 2.0% |
| Immigrants | Eastern Africa | 97.0 /100 | #89 | Exceptional 2.0% |
| Immigrants | Lebanon | 96.7 /100 | #90 | Exceptional 2.1% |
| Immigrants | Somalia | 96.2 /100 | #91 | Exceptional 2.1% |
| Immigrants | Syria | 96.2 /100 | #92 | Exceptional 2.1% |
| Immigrants | Europe | 96.1 /100 | #93 | Exceptional 2.1% |
| Immigrants | Croatia | 96.0 /100 | #94 | Exceptional 2.1% |
| Australians | 95.9 /100 | #95 | Exceptional 2.1% |
| Romanians | 95.7 /100 | #96 | Exceptional 2.1% |
| Immigrants | Afghanistan | 95.6 /100 | #97 | Exceptional 2.1% |
Demographics Similar to Argentineans by Vision Disability
In terms of vision disability, the demographic groups most similar to Argentineans are Immigrants from Romania (2.0%, a difference of 0.030%), Immigrants from Belgium (2.0%, a difference of 0.040%), Immigrants from Russia (2.0%, a difference of 0.060%), Immigrants from Saudi Arabia (2.0%, a difference of 0.14%), and Armenian (2.0%, a difference of 0.17%).
| Demographics | Rating | Rank | Vision Disability |
| Immigrants | Serbia | 99.4 /100 | #52 | Exceptional 2.0% |
| Immigrants | Belarus | 99.3 /100 | #53 | Exceptional 2.0% |
| Macedonians | 99.3 /100 | #54 | Exceptional 2.0% |
| Laotians | 99.3 /100 | #55 | Exceptional 2.0% |
| Jordanians | 99.2 /100 | #56 | Exceptional 2.0% |
| Somalis | 99.2 /100 | #57 | Exceptional 2.0% |
| Immigrants | Saudi Arabia | 99.2 /100 | #58 | Exceptional 2.0% |
| Argentineans | 99.1 /100 | #59 | Exceptional 2.0% |
| Immigrants | Romania | 99.1 /100 | #60 | Exceptional 2.0% |
| Immigrants | Belgium | 99.1 /100 | #61 | Exceptional 2.0% |
| Immigrants | Russia | 99.1 /100 | #62 | Exceptional 2.0% |
| Armenians | 99.0 /100 | #63 | Exceptional 2.0% |
| Immigrants | Greece | 99.0 /100 | #64 | Exceptional 2.0% |
| Maltese | 98.9 /100 | #65 | Exceptional 2.0% |
| Immigrants | Argentina | 98.9 /100 | #66 | Exceptional 2.0% |