Immigrants from Lebanon vs Alaskan Athabascan Female Disability
COMPARE
Immigrants from Lebanon
Alaskan Athabascan
Female Disability
Female Disability Comparison
Immigrants from Lebanon
Alaskan Athabascans
11.5%
FEMALE DISABILITY
99.7/ 100
METRIC RATING
75th/ 347
METRIC RANK
13.9%
FEMALE DISABILITY
0.0/ 100
METRIC RATING
315th/ 347
METRIC RANK
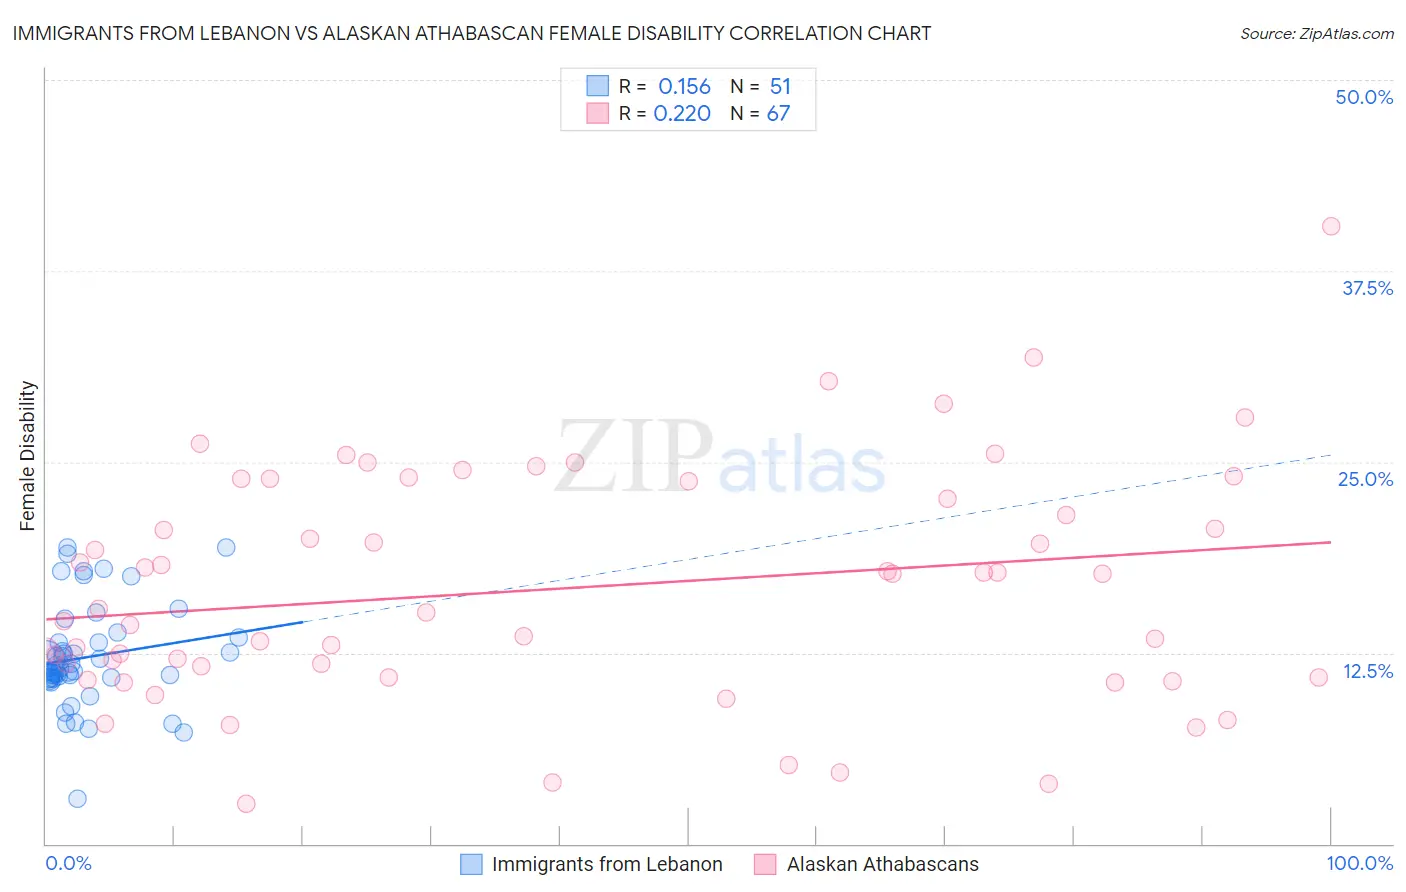
Immigrants from Lebanon vs Alaskan Athabascan Female Disability Correlation Chart
The statistical analysis conducted on geographies consisting of 217,152,791 people shows a poor positive correlation between the proportion of Immigrants from Lebanon and percentage of females with a disability in the United States with a correlation coefficient (R) of 0.156 and weighted average of 11.5%. Similarly, the statistical analysis conducted on geographies consisting of 45,817,882 people shows a weak positive correlation between the proportion of Alaskan Athabascans and percentage of females with a disability in the United States with a correlation coefficient (R) of 0.220 and weighted average of 13.9%, a difference of 21.0%.
Female Disability Correlation Summary
| Measurement | Immigrants from Lebanon | Alaskan Athabascan |
| Minimum | 3.0% | 2.6% |
| Maximum | 19.4% | 40.4% |
| Range | 16.4% | 37.8% |
| Mean | 12.2% | 16.7% |
| Median | 11.5% | 15.4% |
| Interquartile 25% (IQ1) | 10.9% | 10.9% |
| Interquartile 75% (IQ3) | 13.5% | 23.7% |
| Interquartile Range (IQR) | 2.6% | 12.8% |
| Standard Deviation (Sample) | 3.4% | 7.6% |
| Standard Deviation (Population) | 3.4% | 7.6% |
Similar Demographics by Female Disability
Demographics Similar to Immigrants from Lebanon by Female Disability
In terms of female disability, the demographic groups most similar to Immigrants from Lebanon are Immigrants from Eritrea (11.5%, a difference of 0.030%), Immigrants from Afghanistan (11.5%, a difference of 0.030%), Immigrants from South Africa (11.5%, a difference of 0.040%), Sierra Leonean (11.5%, a difference of 0.060%), and Immigrants from Jordan (11.5%, a difference of 0.080%).
| Demographics | Rating | Rank | Female Disability |
| Immigrants | Northern Africa | 99.8 /100 | #68 | Exceptional 11.5% |
| Colombians | 99.8 /100 | #69 | Exceptional 11.5% |
| Immigrants | Chile | 99.8 /100 | #70 | Exceptional 11.5% |
| Immigrants | Ireland | 99.8 /100 | #71 | Exceptional 11.5% |
| Chileans | 99.8 /100 | #72 | Exceptional 11.5% |
| Immigrants | Switzerland | 99.8 /100 | #73 | Exceptional 11.5% |
| Bhutanese | 99.8 /100 | #74 | Exceptional 11.5% |
| Immigrants | Lebanon | 99.7 /100 | #75 | Exceptional 11.5% |
| Immigrants | Eritrea | 99.7 /100 | #76 | Exceptional 11.5% |
| Immigrants | Afghanistan | 99.7 /100 | #77 | Exceptional 11.5% |
| Immigrants | South Africa | 99.7 /100 | #78 | Exceptional 11.5% |
| Sierra Leoneans | 99.7 /100 | #79 | Exceptional 11.5% |
| Immigrants | Jordan | 99.7 /100 | #80 | Exceptional 11.5% |
| Eastern Europeans | 99.7 /100 | #81 | Exceptional 11.5% |
| Luxembourgers | 99.6 /100 | #82 | Exceptional 11.6% |
Demographics Similar to Alaskan Athabascans by Female Disability
In terms of female disability, the demographic groups most similar to Alaskan Athabascans are Spanish American (14.0%, a difference of 0.36%), Chippewa (14.0%, a difference of 0.47%), Paiute (14.0%, a difference of 0.58%), Puget Sound Salish (13.8%, a difference of 0.59%), and Blackfeet (13.8%, a difference of 0.69%).
| Demographics | Rating | Rank | Female Disability |
| Cree | 0.0 /100 | #308 | Tragic 13.7% |
| French American Indians | 0.0 /100 | #309 | Tragic 13.7% |
| Apache | 0.0 /100 | #310 | Tragic 13.7% |
| Hopi | 0.0 /100 | #311 | Tragic 13.7% |
| Delaware | 0.0 /100 | #312 | Tragic 13.8% |
| Blackfeet | 0.0 /100 | #313 | Tragic 13.8% |
| Puget Sound Salish | 0.0 /100 | #314 | Tragic 13.8% |
| Alaskan Athabascans | 0.0 /100 | #315 | Tragic 13.9% |
| Spanish Americans | 0.0 /100 | #316 | Tragic 14.0% |
| Chippewa | 0.0 /100 | #317 | Tragic 14.0% |
| Paiute | 0.0 /100 | #318 | Tragic 14.0% |
| Iroquois | 0.0 /100 | #319 | Tragic 14.0% |
| Americans | 0.0 /100 | #320 | Tragic 14.1% |
| Potawatomi | 0.0 /100 | #321 | Tragic 14.1% |
| Pueblo | 0.0 /100 | #322 | Tragic 14.1% |