Immigrants from Lebanon vs Immigrants from Ireland Female Disability
COMPARE
Immigrants from Lebanon
Immigrants from Ireland
Female Disability
Female Disability Comparison
Immigrants from Lebanon
Immigrants from Ireland
11.5%
FEMALE DISABILITY
99.7/ 100
METRIC RATING
75th/ 347
METRIC RANK
11.5%
FEMALE DISABILITY
99.8/ 100
METRIC RATING
71st/ 347
METRIC RANK
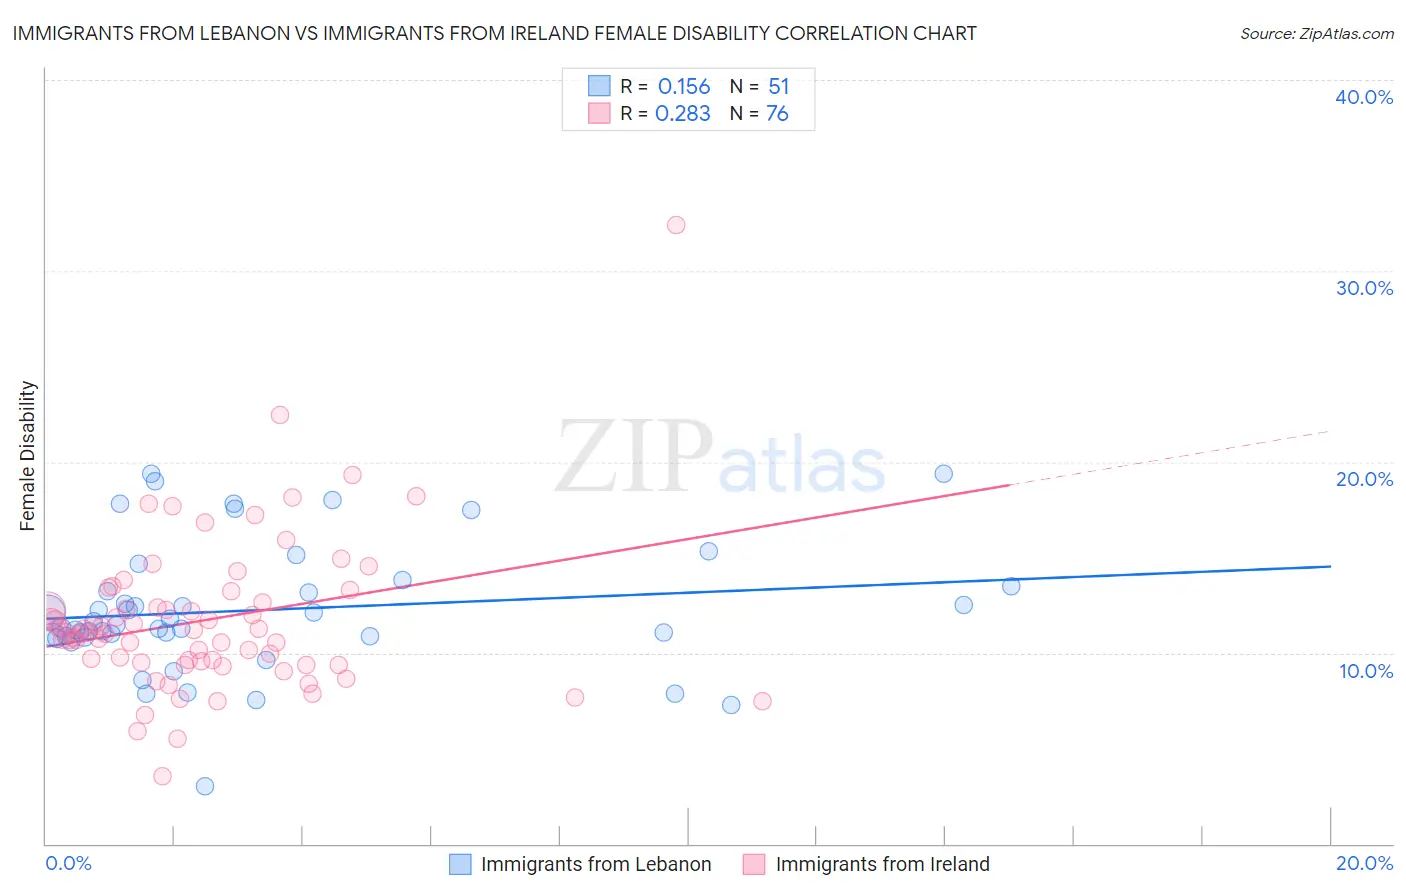
Immigrants from Lebanon vs Immigrants from Ireland Female Disability Correlation Chart
The statistical analysis conducted on geographies consisting of 217,152,791 people shows a poor positive correlation between the proportion of Immigrants from Lebanon and percentage of females with a disability in the United States with a correlation coefficient (R) of 0.156 and weighted average of 11.5%. Similarly, the statistical analysis conducted on geographies consisting of 240,772,628 people shows a weak positive correlation between the proportion of Immigrants from Ireland and percentage of females with a disability in the United States with a correlation coefficient (R) of 0.283 and weighted average of 11.5%, a difference of 0.28%.
Female Disability Correlation Summary
| Measurement | Immigrants from Lebanon | Immigrants from Ireland |
| Minimum | 3.0% | 3.5% |
| Maximum | 19.4% | 32.4% |
| Range | 16.4% | 28.9% |
| Mean | 12.2% | 11.7% |
| Median | 11.5% | 11.1% |
| Interquartile 25% (IQ1) | 10.9% | 9.5% |
| Interquartile 75% (IQ3) | 13.5% | 12.9% |
| Interquartile Range (IQR) | 2.6% | 3.4% |
| Standard Deviation (Sample) | 3.4% | 4.1% |
| Standard Deviation (Population) | 3.4% | 4.1% |
Demographics Similar to Immigrants from Lebanon and Immigrants from Ireland by Female Disability
In terms of female disability, the demographic groups most similar to Immigrants from Lebanon are Immigrants from Eritrea (11.5%, a difference of 0.030%), Immigrants from Afghanistan (11.5%, a difference of 0.030%), Immigrants from South Africa (11.5%, a difference of 0.040%), Sierra Leonean (11.5%, a difference of 0.060%), and Immigrants from Jordan (11.5%, a difference of 0.080%). Similarly, the demographic groups most similar to Immigrants from Ireland are Immigrants from Chile (11.5%, a difference of 0.040%), Colombian (11.5%, a difference of 0.050%), Chilean (11.5%, a difference of 0.070%), Immigrants from Switzerland (11.5%, a difference of 0.080%), and Immigrants from Northern Africa (11.5%, a difference of 0.13%).
| Demographics | Rating | Rank | Female Disability |
| Immigrants | Colombia | 99.9 /100 | #63 | Exceptional 11.4% |
| Immigrants | El Salvador | 99.9 /100 | #64 | Exceptional 11.4% |
| Immigrants | South America | 99.9 /100 | #65 | Exceptional 11.4% |
| Salvadorans | 99.8 /100 | #66 | Exceptional 11.5% |
| Immigrants | Vietnam | 99.8 /100 | #67 | Exceptional 11.5% |
| Immigrants | Northern Africa | 99.8 /100 | #68 | Exceptional 11.5% |
| Colombians | 99.8 /100 | #69 | Exceptional 11.5% |
| Immigrants | Chile | 99.8 /100 | #70 | Exceptional 11.5% |
| Immigrants | Ireland | 99.8 /100 | #71 | Exceptional 11.5% |
| Chileans | 99.8 /100 | #72 | Exceptional 11.5% |
| Immigrants | Switzerland | 99.8 /100 | #73 | Exceptional 11.5% |
| Bhutanese | 99.8 /100 | #74 | Exceptional 11.5% |
| Immigrants | Lebanon | 99.7 /100 | #75 | Exceptional 11.5% |
| Immigrants | Eritrea | 99.7 /100 | #76 | Exceptional 11.5% |
| Immigrants | Afghanistan | 99.7 /100 | #77 | Exceptional 11.5% |
| Immigrants | South Africa | 99.7 /100 | #78 | Exceptional 11.5% |
| Sierra Leoneans | 99.7 /100 | #79 | Exceptional 11.5% |
| Immigrants | Jordan | 99.7 /100 | #80 | Exceptional 11.5% |
| Eastern Europeans | 99.7 /100 | #81 | Exceptional 11.5% |
| Luxembourgers | 99.6 /100 | #82 | Exceptional 11.6% |
| Immigrants | Serbia | 99.6 /100 | #83 | Exceptional 11.6% |