Kenyan vs Alaskan Athabascan Female Disability
COMPARE
Kenyan
Alaskan Athabascan
Female Disability
Female Disability Comparison
Kenyans
Alaskan Athabascans
11.9%
FEMALE DISABILITY
94.5/ 100
METRIC RATING
133rd/ 347
METRIC RANK
13.9%
FEMALE DISABILITY
0.0/ 100
METRIC RATING
315th/ 347
METRIC RANK
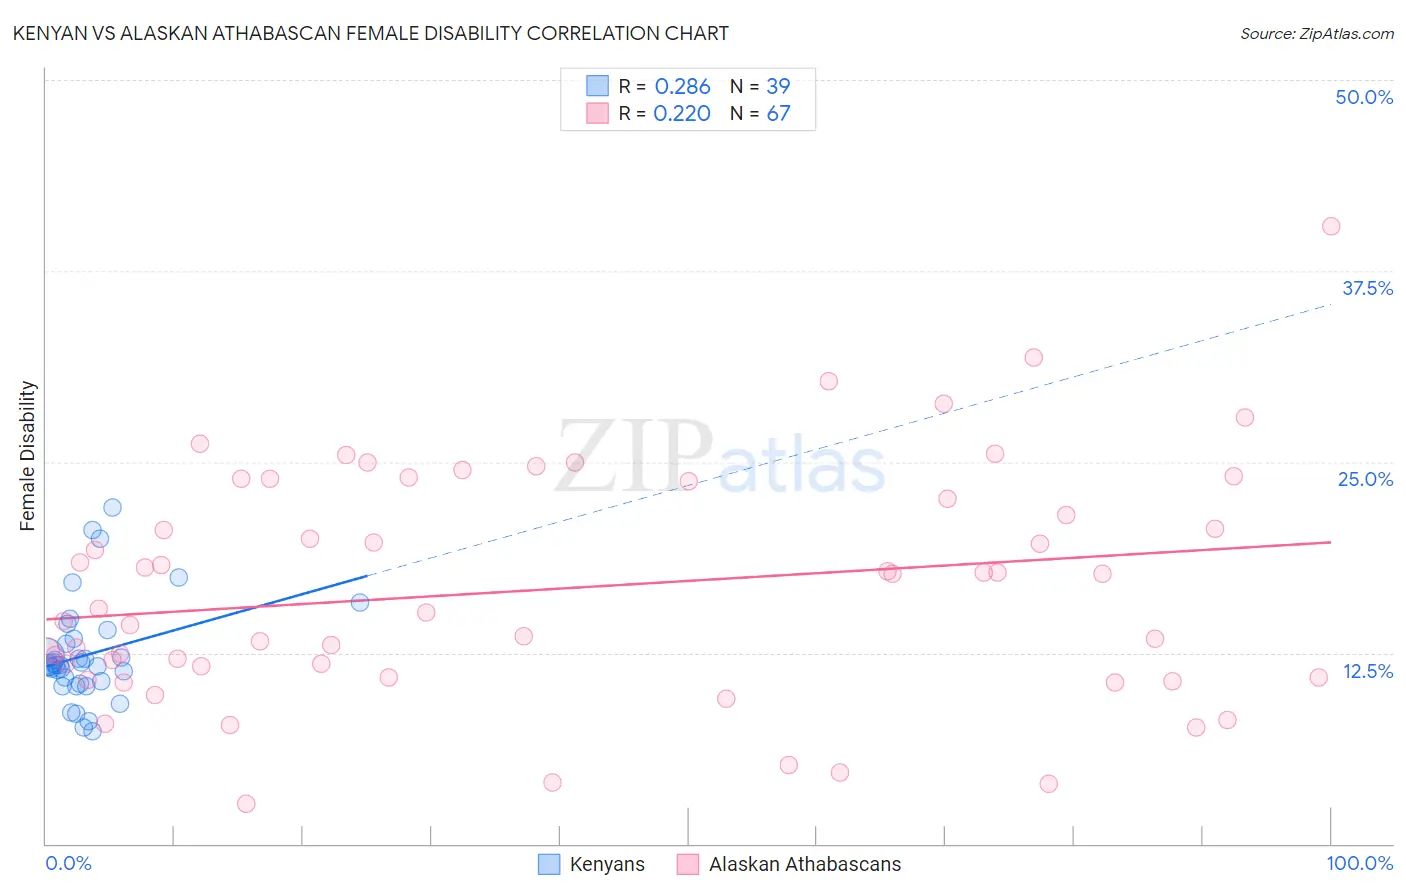
Kenyan vs Alaskan Athabascan Female Disability Correlation Chart
The statistical analysis conducted on geographies consisting of 168,210,759 people shows a weak positive correlation between the proportion of Kenyans and percentage of females with a disability in the United States with a correlation coefficient (R) of 0.286 and weighted average of 11.9%. Similarly, the statistical analysis conducted on geographies consisting of 45,817,882 people shows a weak positive correlation between the proportion of Alaskan Athabascans and percentage of females with a disability in the United States with a correlation coefficient (R) of 0.220 and weighted average of 13.9%, a difference of 17.3%.
Female Disability Correlation Summary
| Measurement | Kenyan | Alaskan Athabascan |
| Minimum | 7.3% | 2.6% |
| Maximum | 22.0% | 40.4% |
| Range | 14.6% | 37.8% |
| Mean | 12.4% | 16.7% |
| Median | 11.7% | 15.4% |
| Interquartile 25% (IQ1) | 10.5% | 10.9% |
| Interquartile 75% (IQ3) | 13.4% | 23.7% |
| Interquartile Range (IQR) | 2.9% | 12.8% |
| Standard Deviation (Sample) | 3.3% | 7.6% |
| Standard Deviation (Population) | 3.3% | 7.6% |
Similar Demographics by Female Disability
Demographics Similar to Kenyans by Female Disability
In terms of female disability, the demographic groups most similar to Kenyans are Immigrants from Nicaragua (11.9%, a difference of 0.0%), Immigrants from Syria (11.9%, a difference of 0.010%), Central American (11.9%, a difference of 0.070%), Ugandan (11.9%, a difference of 0.090%), and Arab (11.9%, a difference of 0.11%).
| Demographics | Rating | Rank | Female Disability |
| Immigrants | Europe | 96.2 /100 | #126 | Exceptional 11.8% |
| South American Indians | 95.8 /100 | #127 | Exceptional 11.8% |
| Immigrants | Latvia | 95.6 /100 | #128 | Exceptional 11.8% |
| Macedonians | 95.5 /100 | #129 | Exceptional 11.8% |
| Nicaraguans | 95.2 /100 | #130 | Exceptional 11.9% |
| Arabs | 95.1 /100 | #131 | Exceptional 11.9% |
| Immigrants | Syria | 94.6 /100 | #132 | Exceptional 11.9% |
| Kenyans | 94.5 /100 | #133 | Exceptional 11.9% |
| Immigrants | Nicaragua | 94.5 /100 | #134 | Exceptional 11.9% |
| Central Americans | 94.2 /100 | #135 | Exceptional 11.9% |
| Ugandans | 94.0 /100 | #136 | Exceptional 11.9% |
| Immigrants | Norway | 93.8 /100 | #137 | Exceptional 11.9% |
| Ecuadorians | 93.4 /100 | #138 | Exceptional 11.9% |
| Immigrants | Hungary | 92.8 /100 | #139 | Exceptional 11.9% |
| Romanians | 91.6 /100 | #140 | Exceptional 11.9% |
Demographics Similar to Alaskan Athabascans by Female Disability
In terms of female disability, the demographic groups most similar to Alaskan Athabascans are Spanish American (14.0%, a difference of 0.36%), Chippewa (14.0%, a difference of 0.47%), Paiute (14.0%, a difference of 0.58%), Puget Sound Salish (13.8%, a difference of 0.59%), and Blackfeet (13.8%, a difference of 0.69%).
| Demographics | Rating | Rank | Female Disability |
| Cree | 0.0 /100 | #308 | Tragic 13.7% |
| French American Indians | 0.0 /100 | #309 | Tragic 13.7% |
| Apache | 0.0 /100 | #310 | Tragic 13.7% |
| Hopi | 0.0 /100 | #311 | Tragic 13.7% |
| Delaware | 0.0 /100 | #312 | Tragic 13.8% |
| Blackfeet | 0.0 /100 | #313 | Tragic 13.8% |
| Puget Sound Salish | 0.0 /100 | #314 | Tragic 13.8% |
| Alaskan Athabascans | 0.0 /100 | #315 | Tragic 13.9% |
| Spanish Americans | 0.0 /100 | #316 | Tragic 14.0% |
| Chippewa | 0.0 /100 | #317 | Tragic 14.0% |
| Paiute | 0.0 /100 | #318 | Tragic 14.0% |
| Iroquois | 0.0 /100 | #319 | Tragic 14.0% |
| Americans | 0.0 /100 | #320 | Tragic 14.1% |
| Potawatomi | 0.0 /100 | #321 | Tragic 14.1% |
| Pueblo | 0.0 /100 | #322 | Tragic 14.1% |