Immigrants from Africa vs Alaskan Athabascan Female Disability
COMPARE
Immigrants from Africa
Alaskan Athabascan
Female Disability
Female Disability Comparison
Immigrants from Africa
Alaskan Athabascans
11.9%
FEMALE DISABILITY
90.0/ 100
METRIC RATING
142nd/ 347
METRIC RANK
13.9%
FEMALE DISABILITY
0.0/ 100
METRIC RATING
315th/ 347
METRIC RANK
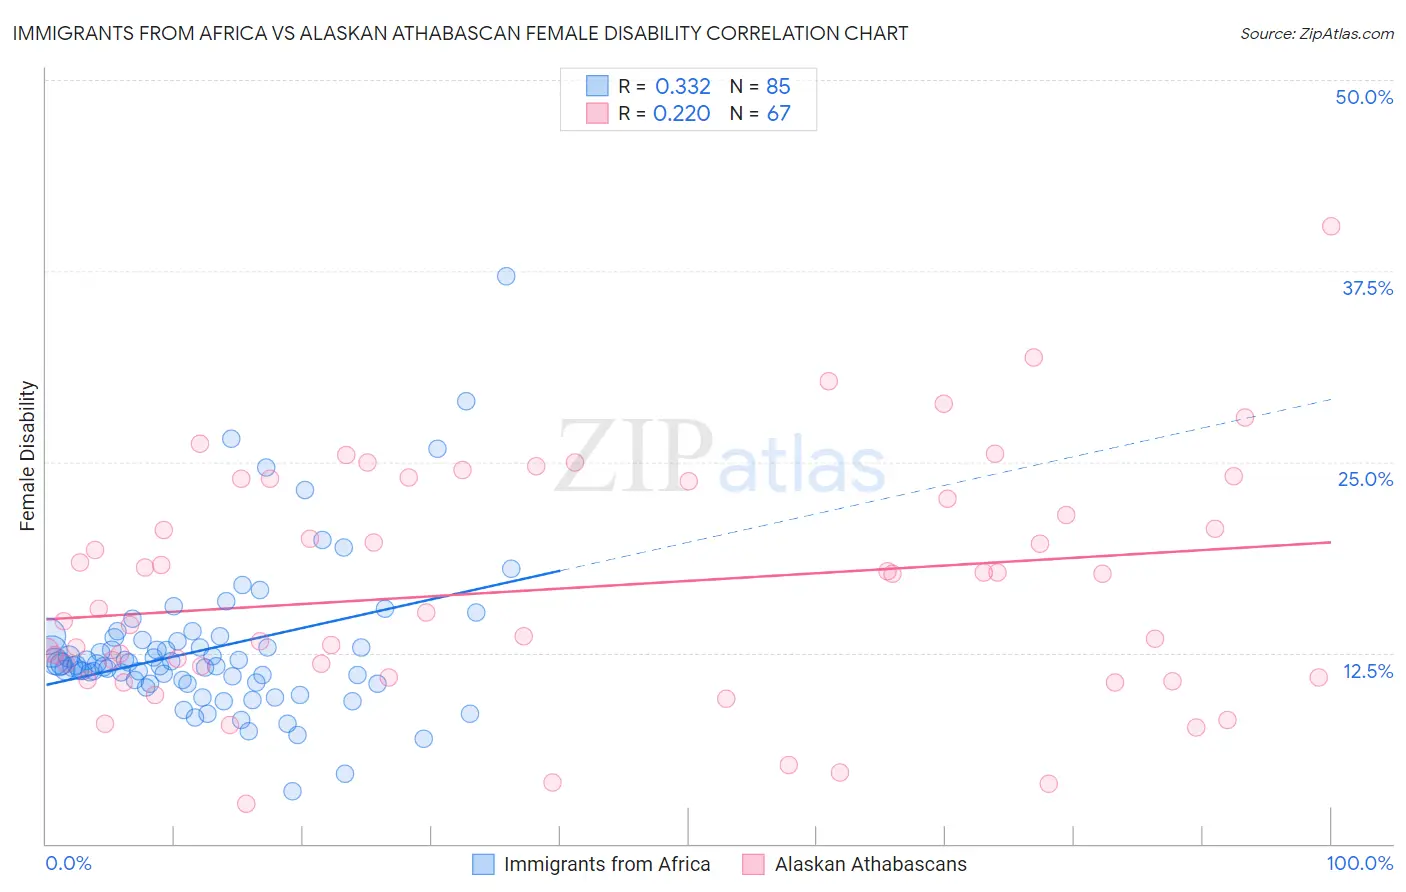
Immigrants from Africa vs Alaskan Athabascan Female Disability Correlation Chart
The statistical analysis conducted on geographies consisting of 469,320,830 people shows a mild positive correlation between the proportion of Immigrants from Africa and percentage of females with a disability in the United States with a correlation coefficient (R) of 0.332 and weighted average of 11.9%. Similarly, the statistical analysis conducted on geographies consisting of 45,817,882 people shows a weak positive correlation between the proportion of Alaskan Athabascans and percentage of females with a disability in the United States with a correlation coefficient (R) of 0.220 and weighted average of 13.9%, a difference of 16.6%.
Female Disability Correlation Summary
| Measurement | Immigrants from Africa | Alaskan Athabascan |
| Minimum | 3.5% | 2.6% |
| Maximum | 37.1% | 40.4% |
| Range | 33.7% | 37.8% |
| Mean | 12.8% | 16.7% |
| Median | 11.8% | 15.4% |
| Interquartile 25% (IQ1) | 10.5% | 10.9% |
| Interquartile 75% (IQ3) | 13.4% | 23.7% |
| Interquartile Range (IQR) | 2.9% | 12.8% |
| Standard Deviation (Sample) | 5.1% | 7.6% |
| Standard Deviation (Population) | 5.1% | 7.6% |
Similar Demographics by Female Disability
Demographics Similar to Immigrants from Africa by Female Disability
In terms of female disability, the demographic groups most similar to Immigrants from Africa are Immigrants from Sudan (11.9%, a difference of 0.040%), Immigrants from Ecuador (11.9%, a difference of 0.17%), Romanian (11.9%, a difference of 0.19%), Immigrants from Austria (12.0%, a difference of 0.21%), and Estonian (12.0%, a difference of 0.21%).
| Demographics | Rating | Rank | Female Disability |
| Central Americans | 94.2 /100 | #135 | Exceptional 11.9% |
| Ugandans | 94.0 /100 | #136 | Exceptional 11.9% |
| Immigrants | Norway | 93.8 /100 | #137 | Exceptional 11.9% |
| Ecuadorians | 93.4 /100 | #138 | Exceptional 11.9% |
| Immigrants | Hungary | 92.8 /100 | #139 | Exceptional 11.9% |
| Romanians | 91.6 /100 | #140 | Exceptional 11.9% |
| Immigrants | Ecuador | 91.5 /100 | #141 | Exceptional 11.9% |
| Immigrants | Africa | 90.0 /100 | #142 | Excellent 11.9% |
| Immigrants | Sudan | 89.6 /100 | #143 | Excellent 11.9% |
| Immigrants | Austria | 87.9 /100 | #144 | Excellent 12.0% |
| Estonians | 87.8 /100 | #145 | Excellent 12.0% |
| Pakistanis | 84.6 /100 | #146 | Excellent 12.0% |
| Nigerians | 84.0 /100 | #147 | Excellent 12.0% |
| Immigrants | Kenya | 83.1 /100 | #148 | Excellent 12.0% |
| Greeks | 82.0 /100 | #149 | Excellent 12.0% |
Demographics Similar to Alaskan Athabascans by Female Disability
In terms of female disability, the demographic groups most similar to Alaskan Athabascans are Spanish American (14.0%, a difference of 0.36%), Chippewa (14.0%, a difference of 0.47%), Paiute (14.0%, a difference of 0.58%), Puget Sound Salish (13.8%, a difference of 0.59%), and Blackfeet (13.8%, a difference of 0.69%).
| Demographics | Rating | Rank | Female Disability |
| Cree | 0.0 /100 | #308 | Tragic 13.7% |
| French American Indians | 0.0 /100 | #309 | Tragic 13.7% |
| Apache | 0.0 /100 | #310 | Tragic 13.7% |
| Hopi | 0.0 /100 | #311 | Tragic 13.7% |
| Delaware | 0.0 /100 | #312 | Tragic 13.8% |
| Blackfeet | 0.0 /100 | #313 | Tragic 13.8% |
| Puget Sound Salish | 0.0 /100 | #314 | Tragic 13.8% |
| Alaskan Athabascans | 0.0 /100 | #315 | Tragic 13.9% |
| Spanish Americans | 0.0 /100 | #316 | Tragic 14.0% |
| Chippewa | 0.0 /100 | #317 | Tragic 14.0% |
| Paiute | 0.0 /100 | #318 | Tragic 14.0% |
| Iroquois | 0.0 /100 | #319 | Tragic 14.0% |
| Americans | 0.0 /100 | #320 | Tragic 14.1% |
| Potawatomi | 0.0 /100 | #321 | Tragic 14.1% |
| Pueblo | 0.0 /100 | #322 | Tragic 14.1% |