Immigrants from Laos vs Immigrants from Malaysia Kindergarten
COMPARE
Immigrants from Laos
Immigrants from Malaysia
Kindergarten
Kindergarten Comparison
Immigrants from Laos
Immigrants from Malaysia
96.9%
KINDERGARTEN
0.0/ 100
METRIC RATING
318th/ 347
METRIC RANK
97.7%
KINDERGARTEN
2.2/ 100
METRIC RATING
234th/ 347
METRIC RANK
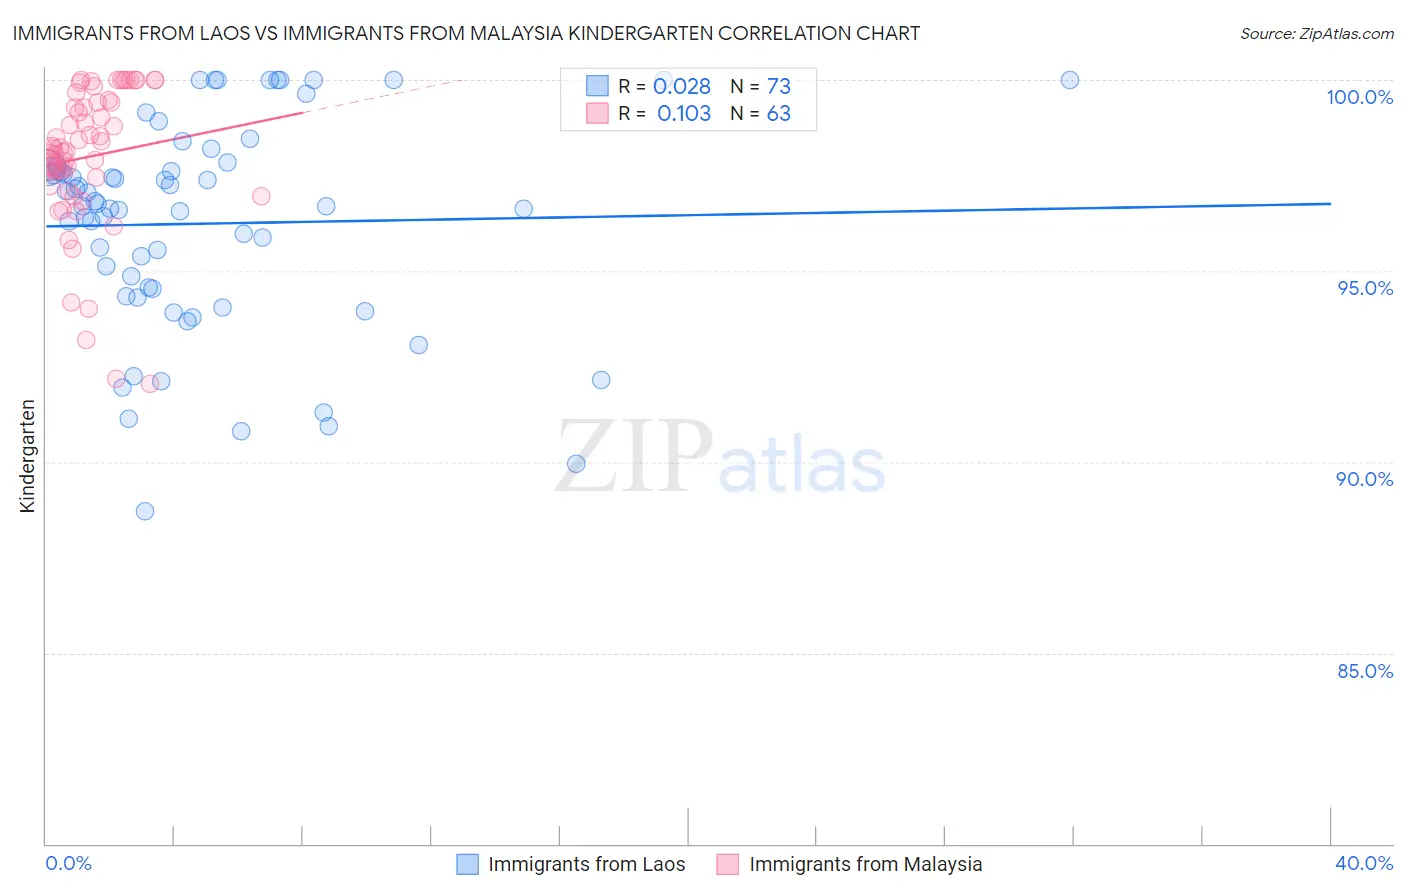
Immigrants from Laos vs Immigrants from Malaysia Kindergarten Correlation Chart
The statistical analysis conducted on geographies consisting of 201,453,273 people shows no correlation between the proportion of Immigrants from Laos and percentage of population with at least kindergarten education in the United States with a correlation coefficient (R) of 0.028 and weighted average of 96.9%. Similarly, the statistical analysis conducted on geographies consisting of 197,973,709 people shows a poor positive correlation between the proportion of Immigrants from Malaysia and percentage of population with at least kindergarten education in the United States with a correlation coefficient (R) of 0.103 and weighted average of 97.7%, a difference of 0.84%.
Kindergarten Correlation Summary
| Measurement | Immigrants from Laos | Immigrants from Malaysia |
| Minimum | 88.7% | 92.0% |
| Maximum | 100.0% | 100.0% |
| Range | 11.3% | 8.0% |
| Mean | 96.2% | 98.0% |
| Median | 96.7% | 98.2% |
| Interquartile 25% (IQ1) | 94.4% | 97.3% |
| Interquartile 75% (IQ3) | 97.7% | 99.4% |
| Interquartile Range (IQR) | 3.3% | 2.2% |
| Standard Deviation (Sample) | 2.7% | 1.9% |
| Standard Deviation (Population) | 2.7% | 1.9% |
Similar Demographics by Kindergarten
Demographics Similar to Immigrants from Laos by Kindergarten
In terms of kindergarten, the demographic groups most similar to Immigrants from Laos are Immigrants from Guyana (96.8%, a difference of 0.010%), Immigrants from Burma/Myanmar (96.8%, a difference of 0.010%), Immigrants from Bangladesh (96.8%, a difference of 0.020%), Mexican American Indian (96.8%, a difference of 0.030%), and Immigrants from Honduras (96.8%, a difference of 0.040%).
| Demographics | Rating | Rank | Kindergarten |
| Sri Lankans | 0.0 /100 | #311 | Tragic 97.0% |
| Guyanese | 0.0 /100 | #312 | Tragic 96.9% |
| Cape Verdeans | 0.0 /100 | #313 | Tragic 96.9% |
| Hondurans | 0.0 /100 | #314 | Tragic 96.9% |
| Immigrants | Belize | 0.0 /100 | #315 | Tragic 96.9% |
| Immigrants | Nicaragua | 0.0 /100 | #316 | Tragic 96.9% |
| Immigrants | Ecuador | 0.0 /100 | #317 | Tragic 96.9% |
| Immigrants | Laos | 0.0 /100 | #318 | Tragic 96.9% |
| Immigrants | Guyana | 0.0 /100 | #319 | Tragic 96.8% |
| Immigrants | Burma/Myanmar | 0.0 /100 | #320 | Tragic 96.8% |
| Immigrants | Bangladesh | 0.0 /100 | #321 | Tragic 96.8% |
| Mexican American Indians | 0.0 /100 | #322 | Tragic 96.8% |
| Immigrants | Honduras | 0.0 /100 | #323 | Tragic 96.8% |
| Vietnamese | 0.0 /100 | #324 | Tragic 96.8% |
| Indonesians | 0.0 /100 | #325 | Tragic 96.8% |
Demographics Similar to Immigrants from Malaysia by Kindergarten
In terms of kindergarten, the demographic groups most similar to Immigrants from Malaysia are Immigrants from Pakistan (97.7%, a difference of 0.0%), Colombian (97.7%, a difference of 0.0%), Immigrants from Western Asia (97.7%, a difference of 0.0%), Immigrants from Uruguay (97.7%, a difference of 0.010%), and Puerto Rican (97.7%, a difference of 0.020%).
| Demographics | Rating | Rank | Kindergarten |
| Immigrants | Costa Rica | 3.6 /100 | #227 | Tragic 97.7% |
| Sub-Saharan Africans | 3.5 /100 | #228 | Tragic 97.7% |
| Sierra Leoneans | 3.4 /100 | #229 | Tragic 97.7% |
| Senegalese | 3.3 /100 | #230 | Tragic 97.7% |
| Puerto Ricans | 2.7 /100 | #231 | Tragic 97.7% |
| Immigrants | Uruguay | 2.6 /100 | #232 | Tragic 97.7% |
| Immigrants | Pakistan | 2.2 /100 | #233 | Tragic 97.7% |
| Immigrants | Malaysia | 2.2 /100 | #234 | Tragic 97.7% |
| Colombians | 2.2 /100 | #235 | Tragic 97.7% |
| Immigrants | Western Asia | 2.1 /100 | #236 | Tragic 97.7% |
| Nigerians | 1.8 /100 | #237 | Tragic 97.6% |
| Immigrants | Eastern Asia | 1.7 /100 | #238 | Tragic 97.6% |
| U.S. Virgin Islanders | 1.7 /100 | #239 | Tragic 97.6% |
| Koreans | 1.6 /100 | #240 | Tragic 97.6% |
| Liberians | 1.3 /100 | #241 | Tragic 97.6% |