Northern European vs Immigrants from Malaysia Disability Age Over 75
COMPARE
Northern European
Immigrants from Malaysia
Disability Age Over 75
Disability Age Over 75 Comparison
Northern Europeans
Immigrants from Malaysia
46.3%
DISABILITY AGE OVER 75
98.3/ 100
METRIC RATING
90th/ 347
METRIC RANK
46.4%
DISABILITY AGE OVER 75
97.1/ 100
METRIC RATING
102nd/ 347
METRIC RANK
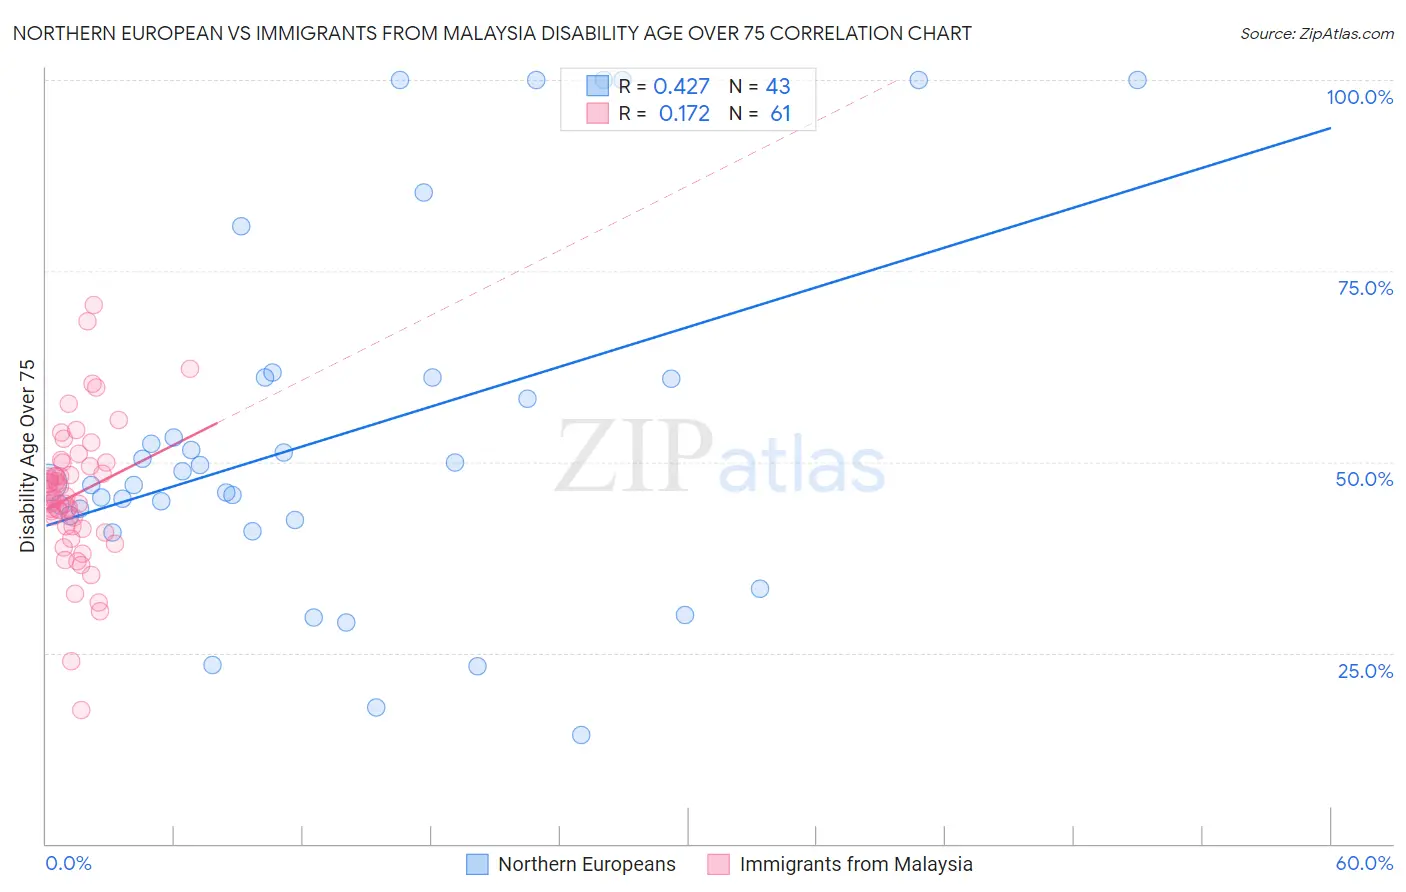
Northern European vs Immigrants from Malaysia Disability Age Over 75 Correlation Chart
The statistical analysis conducted on geographies consisting of 405,622,868 people shows a moderate positive correlation between the proportion of Northern Europeans and percentage of population with a disability over the age of 75 in the United States with a correlation coefficient (R) of 0.427 and weighted average of 46.3%. Similarly, the statistical analysis conducted on geographies consisting of 197,852,473 people shows a poor positive correlation between the proportion of Immigrants from Malaysia and percentage of population with a disability over the age of 75 in the United States with a correlation coefficient (R) of 0.172 and weighted average of 46.4%, a difference of 0.32%.
Disability Age Over 75 Correlation Summary
| Measurement | Northern European | Immigrants from Malaysia |
| Minimum | 14.3% | 17.5% |
| Maximum | 100.0% | 70.6% |
| Range | 85.7% | 53.1% |
| Mean | 53.5% | 45.6% |
| Median | 47.4% | 45.2% |
| Interquartile 25% (IQ1) | 42.4% | 41.4% |
| Interquartile 75% (IQ3) | 61.1% | 49.7% |
| Interquartile Range (IQR) | 18.7% | 8.3% |
| Standard Deviation (Sample) | 23.4% | 9.1% |
| Standard Deviation (Population) | 23.1% | 9.0% |
Demographics Similar to Northern Europeans and Immigrants from Malaysia by Disability Age Over 75
In terms of disability age over 75, the demographic groups most similar to Northern Europeans are Immigrants from Saudi Arabia (46.3%, a difference of 0.010%), Immigrants from Egypt (46.3%, a difference of 0.010%), Uruguayan (46.2%, a difference of 0.020%), German (46.3%, a difference of 0.050%), and Ugandan (46.3%, a difference of 0.060%). Similarly, the demographic groups most similar to Immigrants from Malaysia are Ukrainian (46.4%, a difference of 0.010%), Israeli (46.4%, a difference of 0.020%), Immigrants from Cameroon (46.4%, a difference of 0.050%), Immigrants from Kuwait (46.4%, a difference of 0.060%), and Palestinian (46.3%, a difference of 0.12%).
| Demographics | Rating | Rank | Disability Age Over 75 |
| Romanians | 98.6 /100 | #86 | Exceptional 46.2% |
| Danes | 98.6 /100 | #87 | Exceptional 46.2% |
| Uruguayans | 98.4 /100 | #88 | Exceptional 46.2% |
| Immigrants | Saudi Arabia | 98.4 /100 | #89 | Exceptional 46.3% |
| Northern Europeans | 98.3 /100 | #90 | Exceptional 46.3% |
| Immigrants | Egypt | 98.3 /100 | #91 | Exceptional 46.3% |
| Germans | 98.2 /100 | #92 | Exceptional 46.3% |
| Ugandans | 98.2 /100 | #93 | Exceptional 46.3% |
| Albanians | 98.1 /100 | #94 | Exceptional 46.3% |
| Immigrants | Brazil | 98.0 /100 | #95 | Exceptional 46.3% |
| Immigrants | China | 98.0 /100 | #96 | Exceptional 46.3% |
| Finns | 97.9 /100 | #97 | Exceptional 46.3% |
| Immigrants | Japan | 97.8 /100 | #98 | Exceptional 46.3% |
| Palestinians | 97.7 /100 | #99 | Exceptional 46.3% |
| Immigrants | Eastern Europe | 97.7 /100 | #100 | Exceptional 46.3% |
| Mongolians | 97.7 /100 | #101 | Exceptional 46.3% |
| Immigrants | Malaysia | 97.1 /100 | #102 | Exceptional 46.4% |
| Ukrainians | 97.1 /100 | #103 | Exceptional 46.4% |
| Israelis | 97.0 /100 | #104 | Exceptional 46.4% |
| Immigrants | Cameroon | 96.9 /100 | #105 | Exceptional 46.4% |
| Immigrants | Kuwait | 96.8 /100 | #106 | Exceptional 46.4% |