Immigrants from Laos vs German Russian In Labor Force | Age 25-29
COMPARE
Immigrants from Laos
German Russian
In Labor Force | Age 25-29
In Labor Force | Age 25-29 Comparison
Immigrants from Laos
German Russians
84.8%
IN LABOR FORCE | AGE 25-29
69.0/ 100
METRIC RATING
144th/ 347
METRIC RANK
85.8%
IN LABOR FORCE | AGE 25-29
100.0/ 100
METRIC RATING
31st/ 347
METRIC RANK
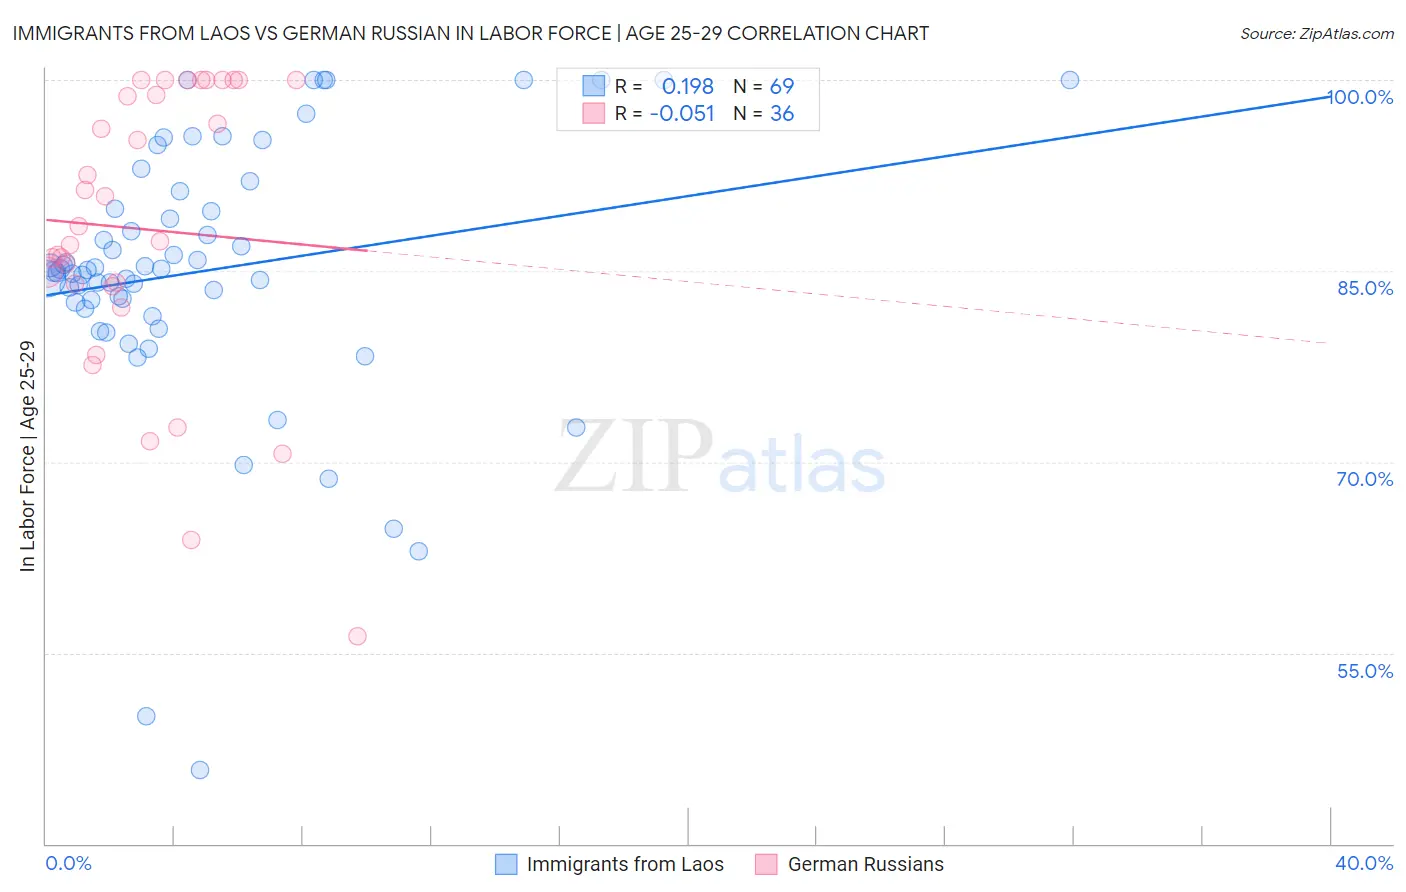
Immigrants from Laos vs German Russian In Labor Force | Age 25-29 Correlation Chart
The statistical analysis conducted on geographies consisting of 201,457,700 people shows a poor positive correlation between the proportion of Immigrants from Laos and labor force participation rate among population between the ages 25 and 29 in the United States with a correlation coefficient (R) of 0.198 and weighted average of 84.8%. Similarly, the statistical analysis conducted on geographies consisting of 96,455,675 people shows a slight negative correlation between the proportion of German Russians and labor force participation rate among population between the ages 25 and 29 in the United States with a correlation coefficient (R) of -0.051 and weighted average of 85.8%, a difference of 1.3%.
In Labor Force | Age 25-29 Correlation Summary
| Measurement | Immigrants from Laos | German Russian |
| Minimum | 45.8% | 56.3% |
| Maximum | 100.0% | 100.0% |
| Range | 54.2% | 43.7% |
| Mean | 85.0% | 88.3% |
| Median | 85.1% | 87.9% |
| Interquartile 25% (IQ1) | 82.3% | 83.9% |
| Interquartile 75% (IQ3) | 90.6% | 99.4% |
| Interquartile Range (IQR) | 8.3% | 15.5% |
| Standard Deviation (Sample) | 10.5% | 11.3% |
| Standard Deviation (Population) | 10.4% | 11.1% |
Similar Demographics by In Labor Force | Age 25-29
Demographics Similar to Immigrants from Laos by In Labor Force | Age 25-29
In terms of in labor force | age 25-29, the demographic groups most similar to Immigrants from Laos are Sri Lankan (84.8%, a difference of 0.0%), Pakistani (84.8%, a difference of 0.010%), Immigrants from Senegal (84.8%, a difference of 0.010%), Icelander (84.8%, a difference of 0.010%), and Immigrants from Asia (84.8%, a difference of 0.010%).
| Demographics | Rating | Rank | In Labor Force | Age 25-29 |
| Immigrants | Canada | 73.5 /100 | #137 | Good 84.8% |
| Armenians | 72.7 /100 | #138 | Good 84.8% |
| Immigrants | Eastern Asia | 72.6 /100 | #139 | Good 84.8% |
| Immigrants | North America | 72.1 /100 | #140 | Good 84.8% |
| Danes | 71.9 /100 | #141 | Good 84.8% |
| Pakistanis | 70.0 /100 | #142 | Good 84.8% |
| Sri Lankans | 69.2 /100 | #143 | Good 84.8% |
| Immigrants | Laos | 69.0 /100 | #144 | Good 84.8% |
| Immigrants | Senegal | 68.3 /100 | #145 | Good 84.8% |
| Icelanders | 68.2 /100 | #146 | Good 84.8% |
| Immigrants | Asia | 68.2 /100 | #147 | Good 84.8% |
| Immigrants | England | 65.2 /100 | #148 | Good 84.7% |
| Peruvians | 64.7 /100 | #149 | Good 84.7% |
| Swiss | 64.7 /100 | #150 | Good 84.7% |
| Colombians | 62.8 /100 | #151 | Good 84.7% |
Demographics Similar to German Russians by In Labor Force | Age 25-29
In terms of in labor force | age 25-29, the demographic groups most similar to German Russians are Slovak (85.8%, a difference of 0.0%), Immigrants from Bulgaria (85.8%, a difference of 0.0%), Immigrants from Serbia (85.9%, a difference of 0.010%), Lithuanian (85.8%, a difference of 0.030%), and Cypriot (85.8%, a difference of 0.040%).
| Demographics | Rating | Rank | In Labor Force | Age 25-29 |
| Immigrants | Eastern Africa | 100.0 /100 | #24 | Exceptional 86.0% |
| Sudanese | 100.0 /100 | #25 | Exceptional 85.9% |
| Immigrants | North Macedonia | 100.0 /100 | #26 | Exceptional 85.9% |
| Paraguayans | 100.0 /100 | #27 | Exceptional 85.9% |
| Ugandans | 100.0 /100 | #28 | Exceptional 85.9% |
| Immigrants | Liberia | 100.0 /100 | #29 | Exceptional 85.9% |
| Immigrants | Serbia | 100.0 /100 | #30 | Exceptional 85.9% |
| German Russians | 100.0 /100 | #31 | Exceptional 85.8% |
| Slovaks | 100.0 /100 | #32 | Exceptional 85.8% |
| Immigrants | Bulgaria | 100.0 /100 | #33 | Exceptional 85.8% |
| Lithuanians | 99.9 /100 | #34 | Exceptional 85.8% |
| Cypriots | 99.9 /100 | #35 | Exceptional 85.8% |
| Immigrants | Nepal | 99.9 /100 | #36 | Exceptional 85.8% |
| Poles | 99.9 /100 | #37 | Exceptional 85.8% |
| Sierra Leoneans | 99.9 /100 | #38 | Exceptional 85.8% |