Immigrants from Kuwait vs Yuman Female Disability
COMPARE
Immigrants from Kuwait
Yuman
Female Disability
Female Disability Comparison
Immigrants from Kuwait
Yuman
11.1%
FEMALE DISABILITY
100.0/ 100
METRIC RATING
31st/ 347
METRIC RANK
14.5%
FEMALE DISABILITY
0.0/ 100
METRIC RATING
330th/ 347
METRIC RANK
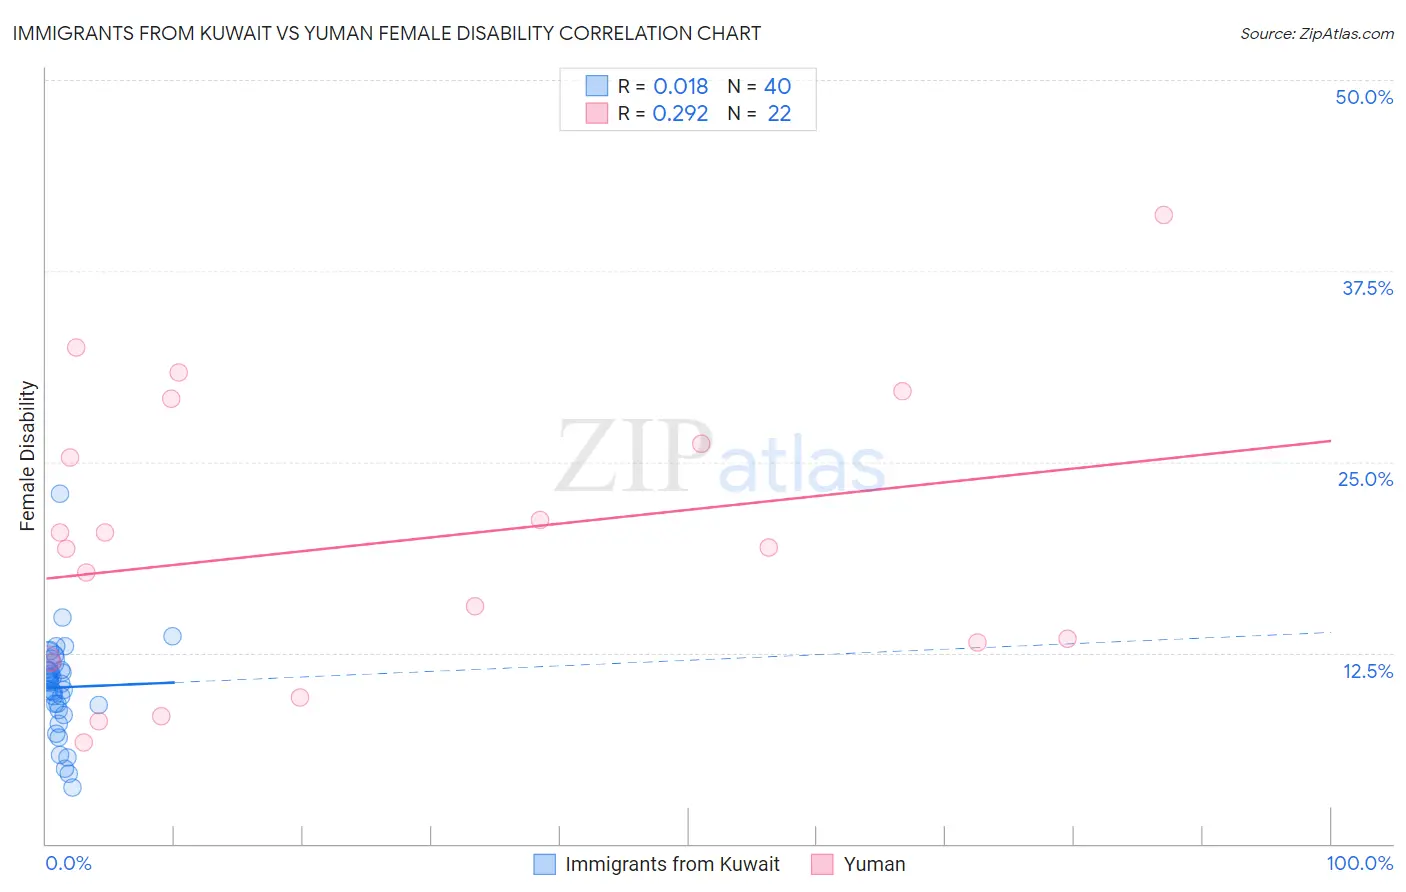
Immigrants from Kuwait vs Yuman Female Disability Correlation Chart
The statistical analysis conducted on geographies consisting of 136,914,007 people shows no correlation between the proportion of Immigrants from Kuwait and percentage of females with a disability in the United States with a correlation coefficient (R) of 0.018 and weighted average of 11.1%. Similarly, the statistical analysis conducted on geographies consisting of 40,663,029 people shows a weak positive correlation between the proportion of Yuman and percentage of females with a disability in the United States with a correlation coefficient (R) of 0.292 and weighted average of 14.5%, a difference of 30.5%.
Female Disability Correlation Summary
| Measurement | Immigrants from Kuwait | Yuman |
| Minimum | 3.7% | 6.6% |
| Maximum | 22.9% | 41.2% |
| Range | 19.3% | 34.6% |
| Mean | 10.2% | 19.6% |
| Median | 10.6% | 19.4% |
| Interquartile 25% (IQ1) | 8.9% | 12.1% |
| Interquartile 75% (IQ3) | 11.6% | 26.2% |
| Interquartile Range (IQR) | 2.7% | 14.0% |
| Standard Deviation (Sample) | 3.3% | 9.2% |
| Standard Deviation (Population) | 3.2% | 9.0% |
Similar Demographics by Female Disability
Demographics Similar to Immigrants from Kuwait by Female Disability
In terms of female disability, the demographic groups most similar to Immigrants from Kuwait are Immigrants from Malaysia (11.1%, a difference of 0.10%), Turkish (11.1%, a difference of 0.10%), Egyptian (11.1%, a difference of 0.17%), Immigrants from Australia (11.1%, a difference of 0.17%), and Immigrants from Egypt (11.1%, a difference of 0.25%).
| Demographics | Rating | Rank | Female Disability |
| Immigrants | Argentina | 100.0 /100 | #24 | Exceptional 11.0% |
| Immigrants | Asia | 100.0 /100 | #25 | Exceptional 11.0% |
| Argentineans | 100.0 /100 | #26 | Exceptional 11.0% |
| Immigrants | Turkey | 100.0 /100 | #27 | Exceptional 11.1% |
| Egyptians | 100.0 /100 | #28 | Exceptional 11.1% |
| Immigrants | Malaysia | 100.0 /100 | #29 | Exceptional 11.1% |
| Turks | 100.0 /100 | #30 | Exceptional 11.1% |
| Immigrants | Kuwait | 100.0 /100 | #31 | Exceptional 11.1% |
| Immigrants | Australia | 100.0 /100 | #32 | Exceptional 11.1% |
| Immigrants | Egypt | 100.0 /100 | #33 | Exceptional 11.1% |
| Immigrants | Indonesia | 100.0 /100 | #34 | Exceptional 11.2% |
| Immigrants | Japan | 100.0 /100 | #35 | Exceptional 11.2% |
| Cypriots | 100.0 /100 | #36 | Exceptional 11.2% |
| Ethiopians | 100.0 /100 | #37 | Exceptional 11.2% |
| Immigrants | Ethiopia | 100.0 /100 | #38 | Exceptional 11.2% |
Demographics Similar to Yuman by Female Disability
In terms of female disability, the demographic groups most similar to Yuman are Immigrants from Cabo Verde (14.6%, a difference of 0.42%), Osage (14.3%, a difference of 1.4%), Ottawa (14.2%, a difference of 1.8%), Cape Verdean (14.2%, a difference of 1.8%), and Pima (14.8%, a difference of 2.0%).
| Demographics | Rating | Rank | Female Disability |
| Blacks/African Americans | 0.0 /100 | #323 | Tragic 14.1% |
| Natives/Alaskans | 0.0 /100 | #324 | Tragic 14.1% |
| Navajo | 0.0 /100 | #325 | Tragic 14.2% |
| Comanche | 0.0 /100 | #326 | Tragic 14.2% |
| Ottawa | 0.0 /100 | #327 | Tragic 14.2% |
| Cape Verdeans | 0.0 /100 | #328 | Tragic 14.2% |
| Osage | 0.0 /100 | #329 | Tragic 14.3% |
| Yuman | 0.0 /100 | #330 | Tragic 14.5% |
| Immigrants | Cabo Verde | 0.0 /100 | #331 | Tragic 14.6% |
| Pima | 0.0 /100 | #332 | Tragic 14.8% |
| Immigrants | Azores | 0.0 /100 | #333 | Tragic 14.9% |
| Cherokee | 0.0 /100 | #334 | Tragic 14.9% |
| Cajuns | 0.0 /100 | #335 | Tragic 14.9% |
| Seminole | 0.0 /100 | #336 | Tragic 15.0% |
| Tohono O'odham | 0.0 /100 | #337 | Tragic 15.0% |