Immigrants from Kuwait vs Afghan Female Disability
COMPARE
Immigrants from Kuwait
Afghan
Female Disability
Female Disability Comparison
Immigrants from Kuwait
Afghans
11.1%
FEMALE DISABILITY
100.0/ 100
METRIC RATING
31st/ 347
METRIC RANK
11.2%
FEMALE DISABILITY
100.0/ 100
METRIC RATING
43rd/ 347
METRIC RANK
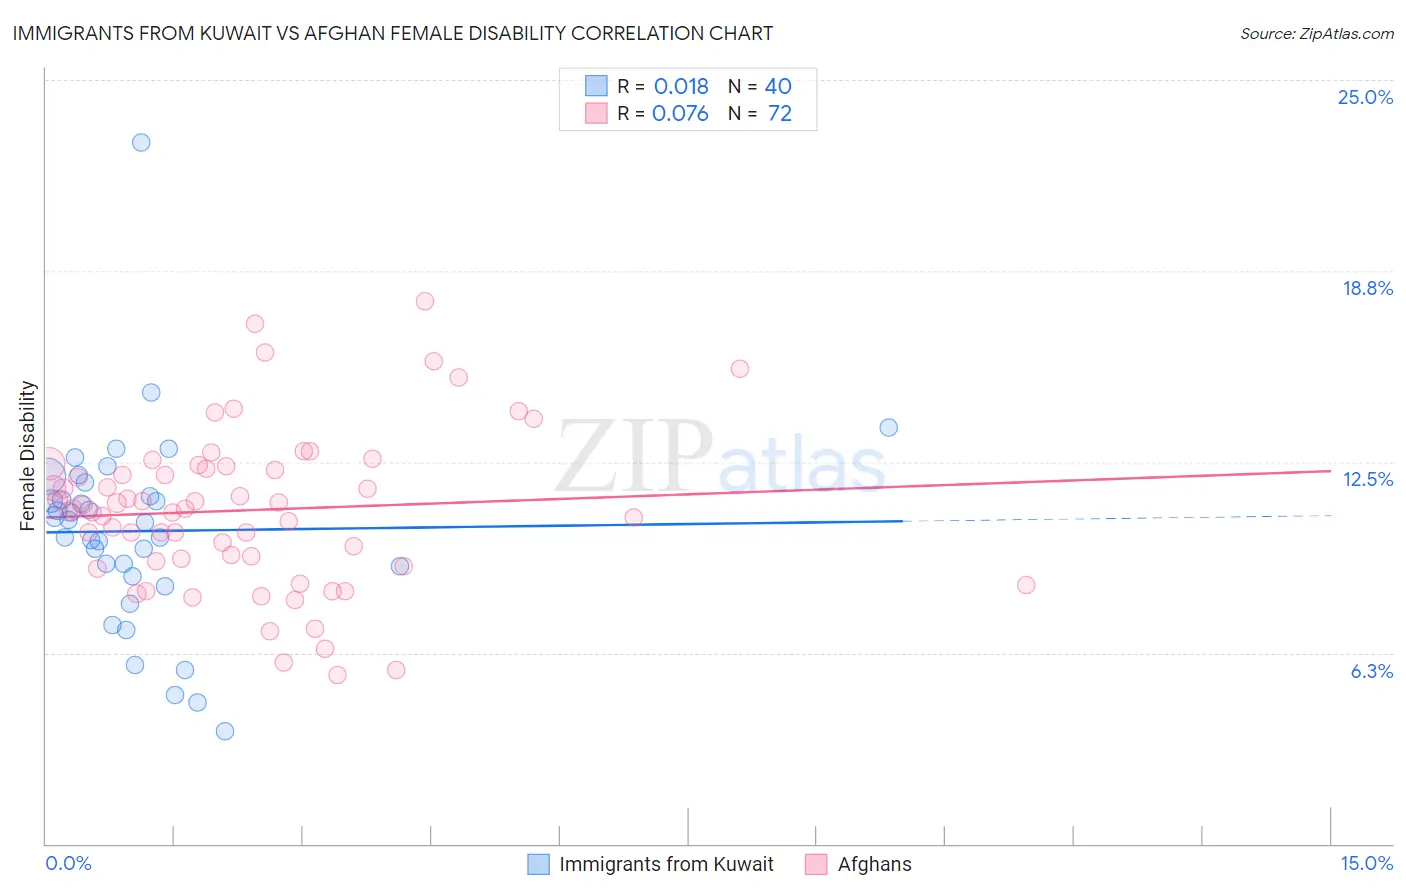
Immigrants from Kuwait vs Afghan Female Disability Correlation Chart
The statistical analysis conducted on geographies consisting of 136,914,007 people shows no correlation between the proportion of Immigrants from Kuwait and percentage of females with a disability in the United States with a correlation coefficient (R) of 0.018 and weighted average of 11.1%. Similarly, the statistical analysis conducted on geographies consisting of 148,868,441 people shows a slight positive correlation between the proportion of Afghans and percentage of females with a disability in the United States with a correlation coefficient (R) of 0.076 and weighted average of 11.2%, a difference of 1.1%.
Female Disability Correlation Summary
| Measurement | Immigrants from Kuwait | Afghan |
| Minimum | 3.7% | 5.5% |
| Maximum | 22.9% | 17.8% |
| Range | 19.3% | 12.3% |
| Mean | 10.2% | 10.9% |
| Median | 10.6% | 11.0% |
| Interquartile 25% (IQ1) | 8.9% | 9.3% |
| Interquartile 75% (IQ3) | 11.6% | 12.3% |
| Interquartile Range (IQR) | 2.7% | 3.0% |
| Standard Deviation (Sample) | 3.3% | 2.6% |
| Standard Deviation (Population) | 3.2% | 2.6% |
Demographics Similar to Immigrants from Kuwait and Afghans by Female Disability
In terms of female disability, the demographic groups most similar to Immigrants from Kuwait are Immigrants from Malaysia (11.1%, a difference of 0.10%), Turkish (11.1%, a difference of 0.10%), Egyptian (11.1%, a difference of 0.17%), Immigrants from Australia (11.1%, a difference of 0.17%), and Immigrants from Egypt (11.1%, a difference of 0.25%). Similarly, the demographic groups most similar to Afghans are Israeli (11.2%, a difference of 0.030%), Paraguayan (11.2%, a difference of 0.12%), Mongolian (11.2%, a difference of 0.14%), Immigrants from Lithuania (11.2%, a difference of 0.17%), and Cambodian (11.3%, a difference of 0.20%).
| Demographics | Rating | Rank | Female Disability |
| Immigrants | Turkey | 100.0 /100 | #27 | Exceptional 11.1% |
| Egyptians | 100.0 /100 | #28 | Exceptional 11.1% |
| Immigrants | Malaysia | 100.0 /100 | #29 | Exceptional 11.1% |
| Turks | 100.0 /100 | #30 | Exceptional 11.1% |
| Immigrants | Kuwait | 100.0 /100 | #31 | Exceptional 11.1% |
| Immigrants | Australia | 100.0 /100 | #32 | Exceptional 11.1% |
| Immigrants | Egypt | 100.0 /100 | #33 | Exceptional 11.1% |
| Immigrants | Indonesia | 100.0 /100 | #34 | Exceptional 11.2% |
| Immigrants | Japan | 100.0 /100 | #35 | Exceptional 11.2% |
| Cypriots | 100.0 /100 | #36 | Exceptional 11.2% |
| Ethiopians | 100.0 /100 | #37 | Exceptional 11.2% |
| Immigrants | Ethiopia | 100.0 /100 | #38 | Exceptional 11.2% |
| Immigrants | Lithuania | 100.0 /100 | #39 | Exceptional 11.2% |
| Mongolians | 100.0 /100 | #40 | Exceptional 11.2% |
| Paraguayans | 100.0 /100 | #41 | Exceptional 11.2% |
| Israelis | 100.0 /100 | #42 | Exceptional 11.2% |
| Afghans | 100.0 /100 | #43 | Exceptional 11.2% |
| Cambodians | 100.0 /100 | #44 | Exceptional 11.3% |
| Immigrants | Sweden | 100.0 /100 | #45 | Exceptional 11.3% |
| Immigrants | Nepal | 100.0 /100 | #46 | Exceptional 11.3% |
| Jordanians | 100.0 /100 | #47 | Exceptional 11.3% |