Immigrants from Kuwait vs Immigrants from Eritrea Vision Disability
COMPARE
Immigrants from Kuwait
Immigrants from Eritrea
Vision Disability
Vision Disability Comparison
Immigrants from Kuwait
Immigrants from Eritrea
2.0%
VISION DISABILITY
99.8/ 100
METRIC RATING
38th/ 347
METRIC RANK
2.0%
VISION DISABILITY
98.4/ 100
METRIC RATING
73rd/ 347
METRIC RANK
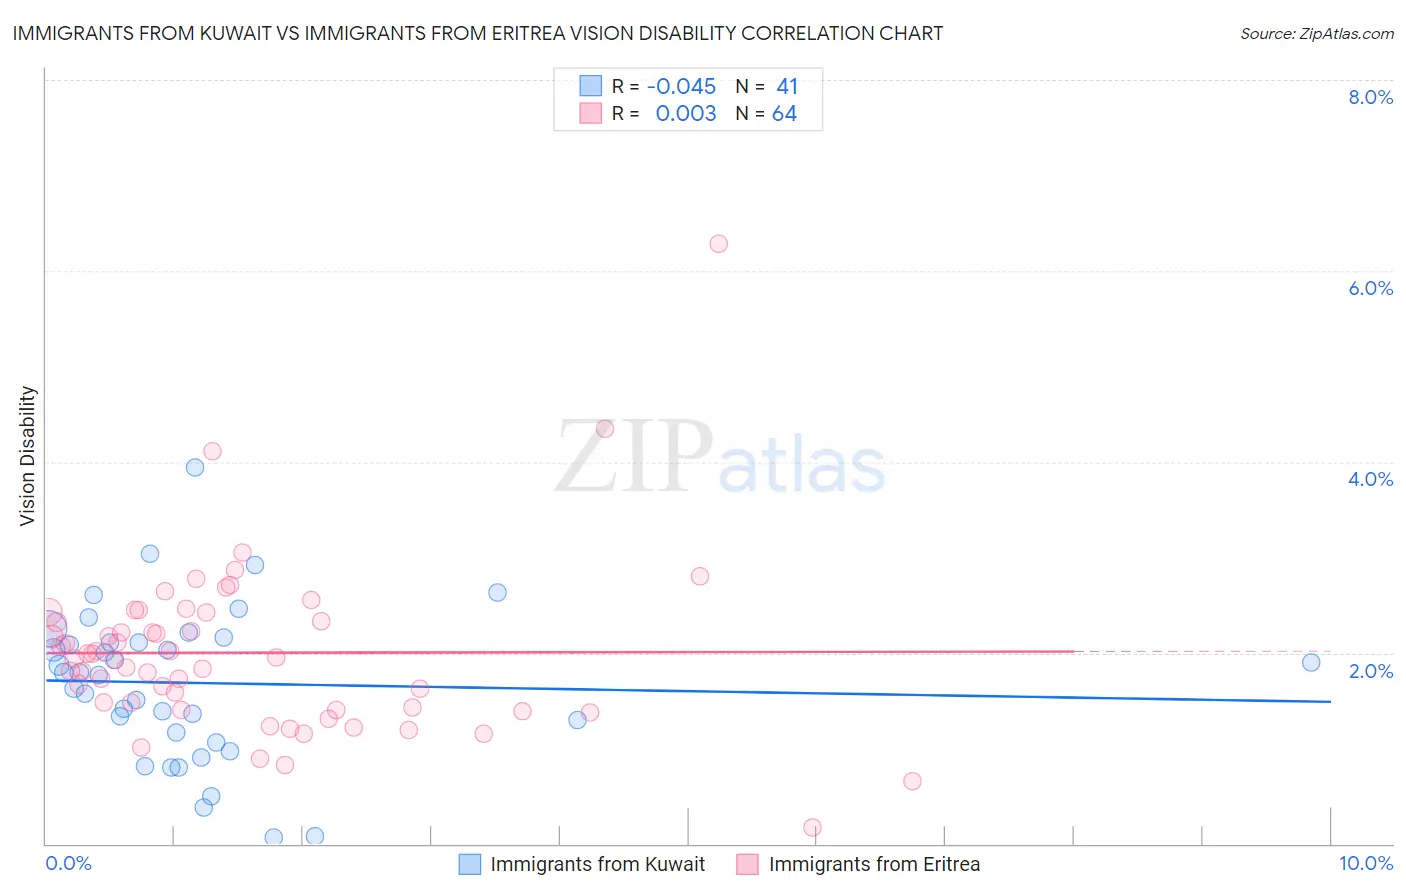
Immigrants from Kuwait vs Immigrants from Eritrea Vision Disability Correlation Chart
The statistical analysis conducted on geographies consisting of 136,909,771 people shows no correlation between the proportion of Immigrants from Kuwait and percentage of population with vision disability in the United States with a correlation coefficient (R) of -0.045 and weighted average of 2.0%. Similarly, the statistical analysis conducted on geographies consisting of 104,851,748 people shows no correlation between the proportion of Immigrants from Eritrea and percentage of population with vision disability in the United States with a correlation coefficient (R) of 0.003 and weighted average of 2.0%, a difference of 3.3%.
Vision Disability Correlation Summary
| Measurement | Immigrants from Kuwait | Immigrants from Eritrea |
| Minimum | 0.068% | 0.17% |
| Maximum | 3.9% | 6.3% |
| Range | 3.9% | 6.1% |
| Mean | 1.7% | 2.0% |
| Median | 1.8% | 1.9% |
| Interquartile 25% (IQ1) | 1.1% | 1.4% |
| Interquartile 75% (IQ3) | 2.1% | 2.4% |
| Interquartile Range (IQR) | 1.0% | 0.96% |
| Standard Deviation (Sample) | 0.81% | 0.90% |
| Standard Deviation (Population) | 0.80% | 0.89% |
Similar Demographics by Vision Disability
Demographics Similar to Immigrants from Kuwait by Vision Disability
In terms of vision disability, the demographic groups most similar to Immigrants from Kuwait are Bhutanese (2.0%, a difference of 0.040%), Zimbabwean (2.0%, a difference of 0.060%), Immigrants from Ireland (2.0%, a difference of 0.26%), Cypriot (2.0%, a difference of 0.28%), and Cambodian (2.0%, a difference of 0.29%).
| Demographics | Rating | Rank | Vision Disability |
| Mongolians | 99.9 /100 | #31 | Exceptional 1.9% |
| Luxembourgers | 99.9 /100 | #32 | Exceptional 1.9% |
| Immigrants | Egypt | 99.9 /100 | #33 | Exceptional 1.9% |
| Immigrants | Turkey | 99.8 /100 | #34 | Exceptional 1.9% |
| Immigrants | Australia | 99.8 /100 | #35 | Exceptional 1.9% |
| Cambodians | 99.8 /100 | #36 | Exceptional 2.0% |
| Bhutanese | 99.8 /100 | #37 | Exceptional 2.0% |
| Immigrants | Kuwait | 99.8 /100 | #38 | Exceptional 2.0% |
| Zimbabweans | 99.7 /100 | #39 | Exceptional 2.0% |
| Immigrants | Ireland | 99.7 /100 | #40 | Exceptional 2.0% |
| Cypriots | 99.7 /100 | #41 | Exceptional 2.0% |
| Immigrants | Ethiopia | 99.7 /100 | #42 | Exceptional 2.0% |
| Eastern Europeans | 99.7 /100 | #43 | Exceptional 2.0% |
| Immigrants | Indonesia | 99.7 /100 | #44 | Exceptional 2.0% |
| Ethiopians | 99.7 /100 | #45 | Exceptional 2.0% |
Demographics Similar to Immigrants from Eritrea by Vision Disability
In terms of vision disability, the demographic groups most similar to Immigrants from Eritrea are Palestinian (2.0%, a difference of 0.050%), Immigrants from North Macedonia (2.0%, a difference of 0.060%), Paraguayan (2.0%, a difference of 0.070%), Immigrants from Jordan (2.0%, a difference of 0.080%), and Immigrants from Eastern Europe (2.0%, a difference of 0.11%).
| Demographics | Rating | Rank | Vision Disability |
| Immigrants | Argentina | 98.9 /100 | #66 | Exceptional 2.0% |
| Immigrants | Northern Africa | 98.8 /100 | #67 | Exceptional 2.0% |
| Immigrants | Czechoslovakia | 98.7 /100 | #68 | Exceptional 2.0% |
| Russians | 98.6 /100 | #69 | Exceptional 2.0% |
| Immigrants | Kazakhstan | 98.6 /100 | #70 | Exceptional 2.0% |
| Immigrants | Northern Europe | 98.6 /100 | #71 | Exceptional 2.0% |
| Immigrants | France | 98.5 /100 | #72 | Exceptional 2.0% |
| Immigrants | Eritrea | 98.4 /100 | #73 | Exceptional 2.0% |
| Palestinians | 98.3 /100 | #74 | Exceptional 2.0% |
| Immigrants | North Macedonia | 98.3 /100 | #75 | Exceptional 2.0% |
| Paraguayans | 98.3 /100 | #76 | Exceptional 2.0% |
| Immigrants | Jordan | 98.3 /100 | #77 | Exceptional 2.0% |
| Immigrants | Eastern Europe | 98.3 /100 | #78 | Exceptional 2.0% |
| Assyrians/Chaldeans/Syriacs | 98.1 /100 | #79 | Exceptional 2.0% |
| Lithuanians | 97.7 /100 | #80 | Exceptional 2.0% |