Yaqui vs New Zealander Disability Age Over 75
COMPARE
Yaqui
New Zealander
Disability Age Over 75
Disability Age Over 75 Comparison
Yaqui
New Zealanders
49.8%
DISABILITY AGE OVER 75
0.0/ 100
METRIC RATING
288th/ 347
METRIC RANK
46.2%
DISABILITY AGE OVER 75
98.8/ 100
METRIC RATING
81st/ 347
METRIC RANK
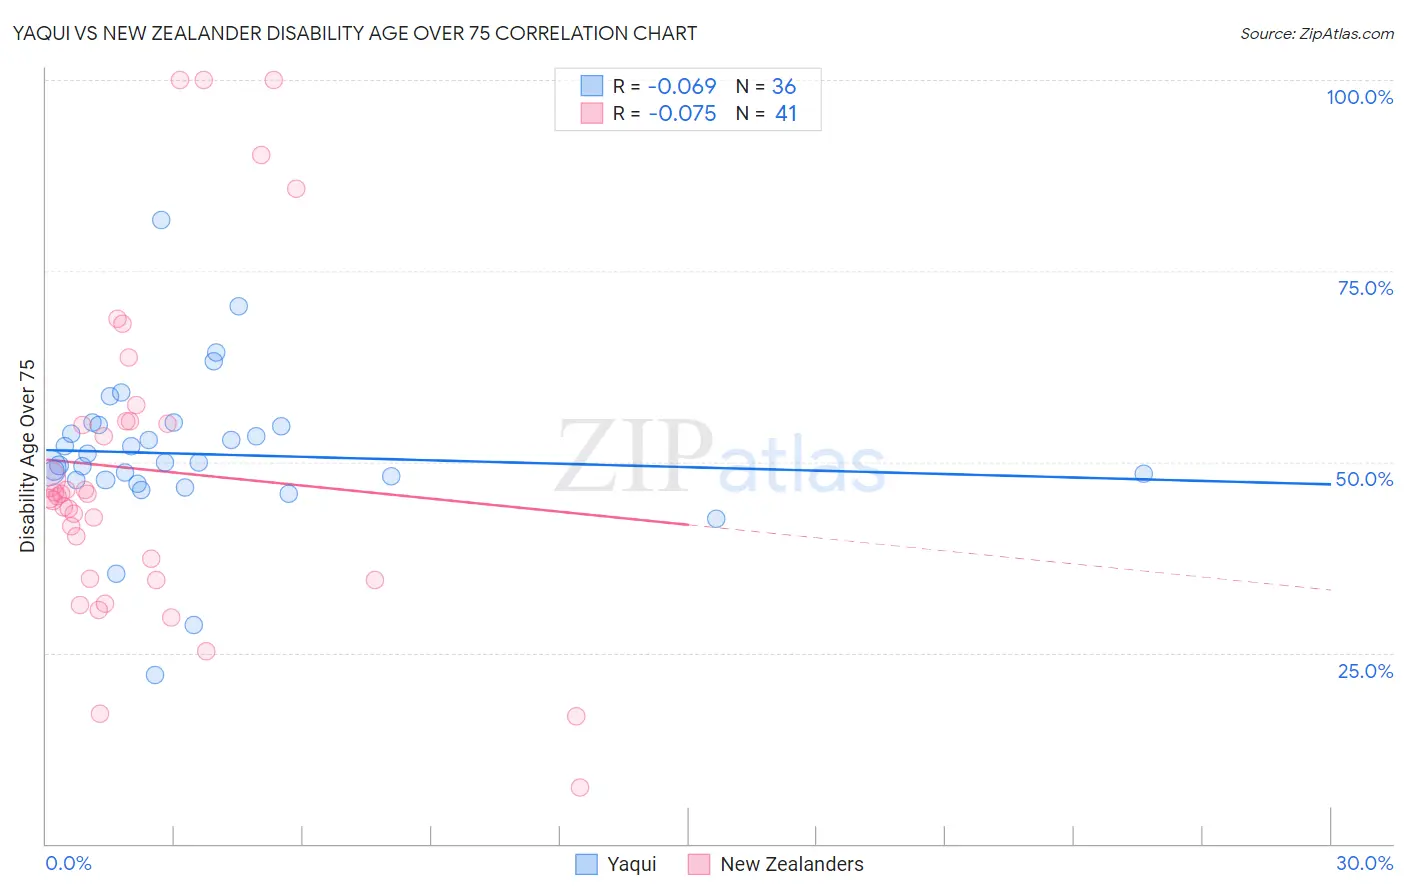
Yaqui vs New Zealander Disability Age Over 75 Correlation Chart
The statistical analysis conducted on geographies consisting of 107,650,566 people shows a slight negative correlation between the proportion of Yaqui and percentage of population with a disability over the age of 75 in the United States with a correlation coefficient (R) of -0.069 and weighted average of 49.8%. Similarly, the statistical analysis conducted on geographies consisting of 106,876,595 people shows a slight negative correlation between the proportion of New Zealanders and percentage of population with a disability over the age of 75 in the United States with a correlation coefficient (R) of -0.075 and weighted average of 46.2%, a difference of 7.8%.
Disability Age Over 75 Correlation Summary
| Measurement | Yaqui | New Zealander |
| Minimum | 22.1% | 7.4% |
| Maximum | 81.7% | 100.0% |
| Range | 59.5% | 92.6% |
| Mean | 51.0% | 49.0% |
| Median | 50.0% | 45.6% |
| Interquartile 25% (IQ1) | 47.6% | 34.6% |
| Interquartile 75% (IQ3) | 54.8% | 55.3% |
| Interquartile Range (IQR) | 7.1% | 20.7% |
| Standard Deviation (Sample) | 10.2% | 21.7% |
| Standard Deviation (Population) | 10.1% | 21.5% |
Similar Demographics by Disability Age Over 75
Demographics Similar to Yaqui by Disability Age Over 75
In terms of disability age over 75, the demographic groups most similar to Yaqui are Sioux (49.7%, a difference of 0.050%), Osage (49.8%, a difference of 0.080%), Puget Sound Salish (49.8%, a difference of 0.090%), Arapaho (49.8%, a difference of 0.090%), and Shoshone (49.9%, a difference of 0.16%).
| Demographics | Rating | Rank | Disability Age Over 75 |
| Belizeans | 0.0 /100 | #281 | Tragic 49.4% |
| Blacks/African Americans | 0.0 /100 | #282 | Tragic 49.5% |
| Samoans | 0.0 /100 | #283 | Tragic 49.5% |
| Immigrants | Latin America | 0.0 /100 | #284 | Tragic 49.5% |
| Crow | 0.0 /100 | #285 | Tragic 49.6% |
| Immigrants | Belize | 0.0 /100 | #286 | Tragic 49.6% |
| Sioux | 0.0 /100 | #287 | Tragic 49.7% |
| Yaqui | 0.0 /100 | #288 | Tragic 49.8% |
| Osage | 0.0 /100 | #289 | Tragic 49.8% |
| Puget Sound Salish | 0.0 /100 | #290 | Tragic 49.8% |
| Arapaho | 0.0 /100 | #291 | Tragic 49.8% |
| Shoshone | 0.0 /100 | #292 | Tragic 49.9% |
| Spanish American Indians | 0.0 /100 | #293 | Tragic 49.9% |
| Immigrants | Cambodia | 0.0 /100 | #294 | Tragic 50.0% |
| Spanish Americans | 0.0 /100 | #295 | Tragic 50.0% |
Demographics Similar to New Zealanders by Disability Age Over 75
In terms of disability age over 75, the demographic groups most similar to New Zealanders are Soviet Union (46.2%, a difference of 0.0%), Swiss (46.2%, a difference of 0.010%), Immigrants from Latvia (46.2%, a difference of 0.020%), Argentinean (46.2%, a difference of 0.020%), and Immigrants from Jordan (46.2%, a difference of 0.030%).
| Demographics | Rating | Rank | Disability Age Over 75 |
| Egyptians | 99.0 /100 | #74 | Exceptional 46.1% |
| Serbians | 99.0 /100 | #75 | Exceptional 46.1% |
| Slavs | 98.9 /100 | #76 | Exceptional 46.1% |
| Immigrants | Eastern Asia | 98.9 /100 | #77 | Exceptional 46.2% |
| Immigrants | Western Europe | 98.8 /100 | #78 | Exceptional 46.2% |
| Swiss | 98.8 /100 | #79 | Exceptional 46.2% |
| Soviet Union | 98.8 /100 | #80 | Exceptional 46.2% |
| New Zealanders | 98.8 /100 | #81 | Exceptional 46.2% |
| Immigrants | Latvia | 98.7 /100 | #82 | Exceptional 46.2% |
| Argentineans | 98.7 /100 | #83 | Exceptional 46.2% |
| Immigrants | Jordan | 98.7 /100 | #84 | Exceptional 46.2% |
| Immigrants | Southern Europe | 98.6 /100 | #85 | Exceptional 46.2% |
| Romanians | 98.6 /100 | #86 | Exceptional 46.2% |
| Danes | 98.6 /100 | #87 | Exceptional 46.2% |
| Uruguayans | 98.4 /100 | #88 | Exceptional 46.2% |