Immigrants from Jordan vs Ecuadorian Hearing Disability
COMPARE
Immigrants from Jordan
Ecuadorian
Hearing Disability
Hearing Disability Comparison
Immigrants from Jordan
Ecuadorians
2.9%
HEARING DISABILITY
83.7/ 100
METRIC RATING
140th/ 347
METRIC RANK
2.5%
HEARING DISABILITY
99.9/ 100
METRIC RATING
14th/ 347
METRIC RANK
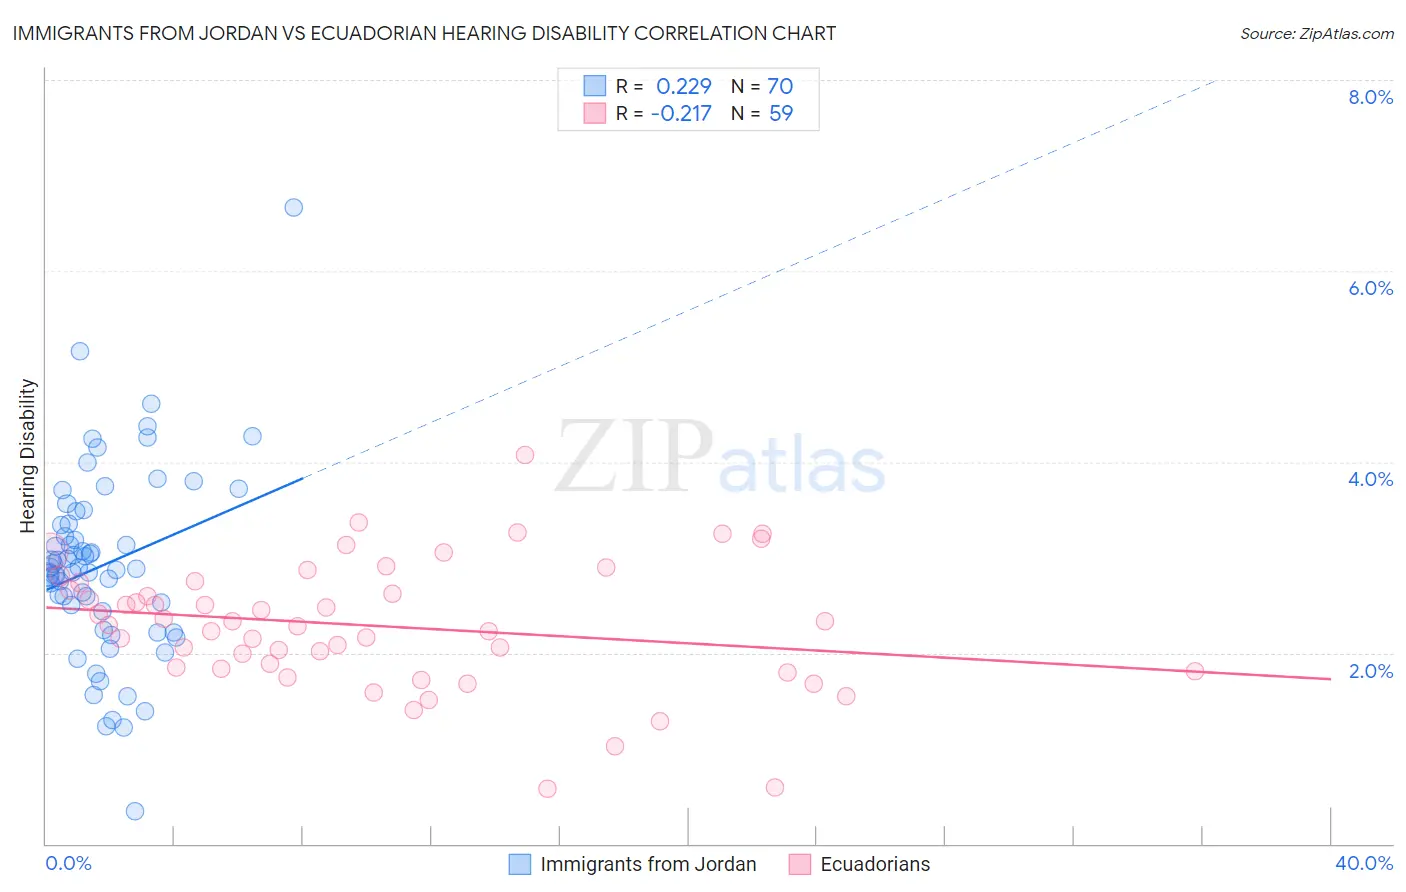
Immigrants from Jordan vs Ecuadorian Hearing Disability Correlation Chart
The statistical analysis conducted on geographies consisting of 181,270,296 people shows a weak positive correlation between the proportion of Immigrants from Jordan and percentage of population with hearing disability in the United States with a correlation coefficient (R) of 0.229 and weighted average of 2.9%. Similarly, the statistical analysis conducted on geographies consisting of 317,698,915 people shows a weak negative correlation between the proportion of Ecuadorians and percentage of population with hearing disability in the United States with a correlation coefficient (R) of -0.217 and weighted average of 2.5%, a difference of 14.8%.
Hearing Disability Correlation Summary
| Measurement | Immigrants from Jordan | Ecuadorian |
| Minimum | 0.34% | 0.58% |
| Maximum | 6.7% | 4.1% |
| Range | 6.3% | 3.5% |
| Mean | 2.9% | 2.3% |
| Median | 2.9% | 2.3% |
| Interquartile 25% (IQ1) | 2.4% | 1.8% |
| Interquartile 75% (IQ3) | 3.4% | 2.7% |
| Interquartile Range (IQR) | 0.92% | 0.90% |
| Standard Deviation (Sample) | 0.99% | 0.67% |
| Standard Deviation (Population) | 0.98% | 0.66% |
Similar Demographics by Hearing Disability
Demographics Similar to Immigrants from Jordan by Hearing Disability
In terms of hearing disability, the demographic groups most similar to Immigrants from Jordan are Bermudan (2.9%, a difference of 0.020%), Immigrants from Costa Rica (2.9%, a difference of 0.060%), Sri Lankan (2.9%, a difference of 0.070%), Subsaharan African (2.9%, a difference of 0.070%), and Immigrants from Brazil (2.9%, a difference of 0.17%).
| Demographics | Rating | Rank | Hearing Disability |
| Immigrants | Syria | 85.8 /100 | #133 | Excellent 2.9% |
| Ugandans | 85.5 /100 | #134 | Excellent 2.9% |
| Soviet Union | 84.8 /100 | #135 | Excellent 2.9% |
| Immigrants | Brazil | 84.6 /100 | #136 | Excellent 2.9% |
| Sri Lankans | 84.1 /100 | #137 | Excellent 2.9% |
| Immigrants | Costa Rica | 84.0 /100 | #138 | Excellent 2.9% |
| Bermudans | 83.8 /100 | #139 | Excellent 2.9% |
| Immigrants | Jordan | 83.7 /100 | #140 | Excellent 2.9% |
| Sub-Saharan Africans | 83.3 /100 | #141 | Excellent 2.9% |
| Laotians | 81.1 /100 | #142 | Excellent 2.9% |
| Immigrants | Bahamas | 80.9 /100 | #143 | Excellent 2.9% |
| Immigrants | Bulgaria | 79.2 /100 | #144 | Good 2.9% |
| Immigrants | Congo | 78.9 /100 | #145 | Good 2.9% |
| Brazilians | 78.7 /100 | #146 | Good 2.9% |
| Tongans | 78.6 /100 | #147 | Good 2.9% |
Demographics Similar to Ecuadorians by Hearing Disability
In terms of hearing disability, the demographic groups most similar to Ecuadorians are Barbadian (2.5%, a difference of 0.30%), Sierra Leonean (2.5%, a difference of 0.32%), Immigrants from West Indies (2.5%, a difference of 0.45%), Trinidadian and Tobagonian (2.5%, a difference of 0.54%), and Immigrants from India (2.5%, a difference of 0.77%).
| Demographics | Rating | Rank | Hearing Disability |
| Immigrants | Bangladesh | 100.0 /100 | #7 | Exceptional 2.4% |
| British West Indians | 100.0 /100 | #8 | Exceptional 2.4% |
| Immigrants | Dominican Republic | 100.0 /100 | #9 | Exceptional 2.4% |
| Immigrants | Ecuador | 99.9 /100 | #10 | Exceptional 2.5% |
| Immigrants | Trinidad and Tobago | 99.9 /100 | #11 | Exceptional 2.5% |
| Trinidadians and Tobagonians | 99.9 /100 | #12 | Exceptional 2.5% |
| Sierra Leoneans | 99.9 /100 | #13 | Exceptional 2.5% |
| Ecuadorians | 99.9 /100 | #14 | Exceptional 2.5% |
| Barbadians | 99.9 /100 | #15 | Exceptional 2.5% |
| Immigrants | West Indies | 99.9 /100 | #16 | Exceptional 2.5% |
| Immigrants | India | 99.9 /100 | #17 | Exceptional 2.5% |
| Dominicans | 99.8 /100 | #18 | Exceptional 2.5% |
| Thais | 99.8 /100 | #19 | Exceptional 2.5% |
| Immigrants | Bolivia | 99.8 /100 | #20 | Exceptional 2.5% |
| Ghanaians | 99.8 /100 | #21 | Exceptional 2.5% |