Immigrants from Jordan vs Armenian Unemployment Among Women with Children Under 18 years
COMPARE
Immigrants from Jordan
Armenian
Unemployment Among Women with Children Under 18 years
Unemployment Among Women with Children Under 18 years Comparison
Immigrants from Jordan
Armenians
5.3%
UNEMPLOYMENT AMONG WOMEN WITH CHILDREN UNDER 18 YEARS
79.5/ 100
METRIC RATING
136th/ 347
METRIC RANK
5.7%
UNEMPLOYMENT AMONG WOMEN WITH CHILDREN UNDER 18 YEARS
4.5/ 100
METRIC RATING
225th/ 347
METRIC RANK
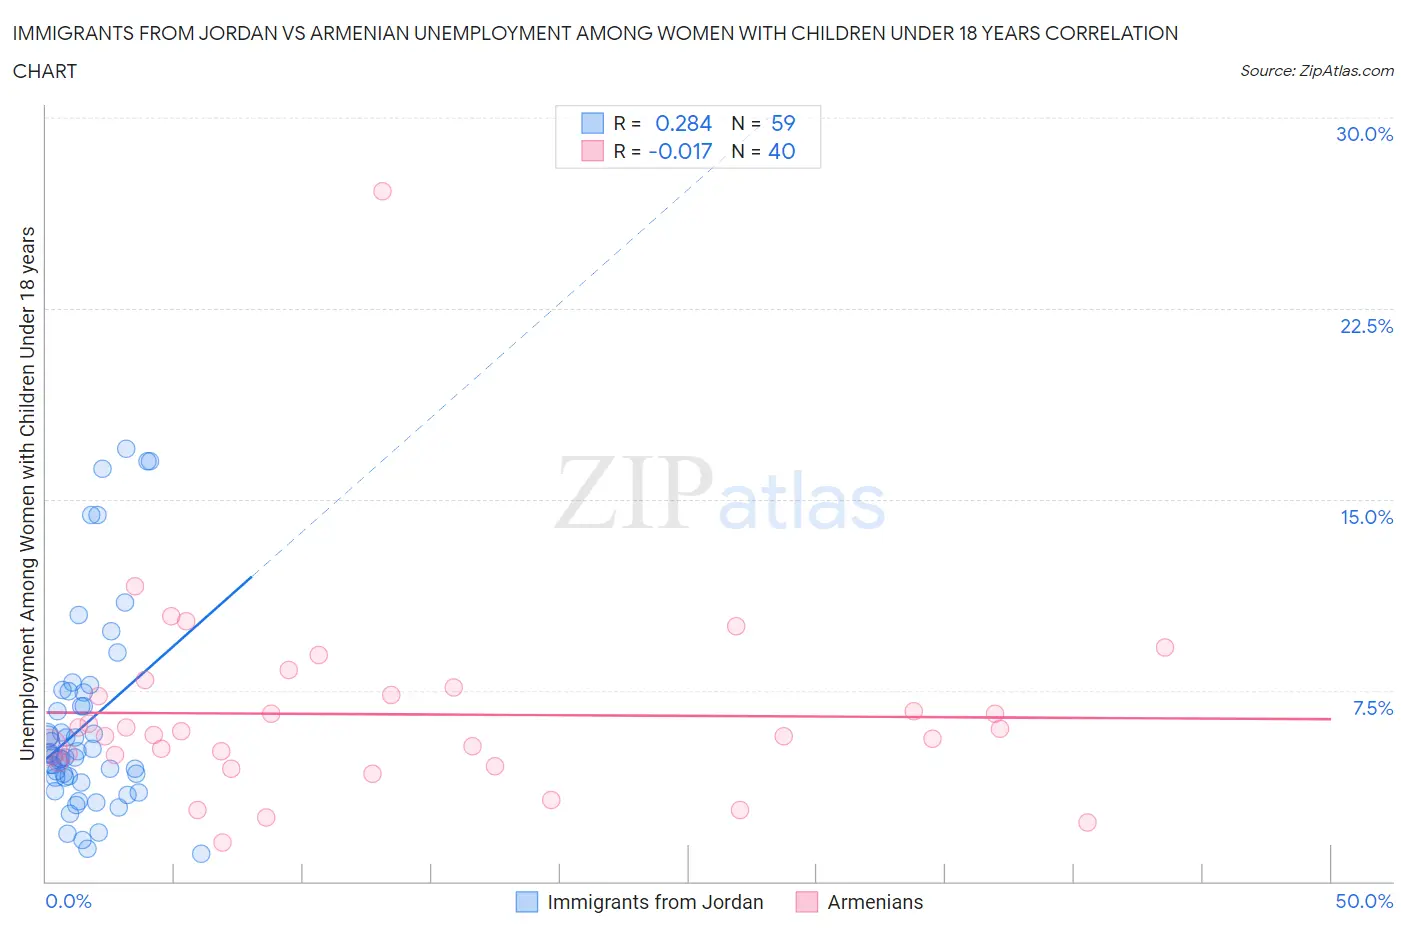
Immigrants from Jordan vs Armenian Unemployment Among Women with Children Under 18 years Correlation Chart
The statistical analysis conducted on geographies consisting of 178,883,646 people shows a weak positive correlation between the proportion of Immigrants from Jordan and unemployment rate among women with children under the age of 18 in the United States with a correlation coefficient (R) of 0.284 and weighted average of 5.3%. Similarly, the statistical analysis conducted on geographies consisting of 300,938,528 people shows no correlation between the proportion of Armenians and unemployment rate among women with children under the age of 18 in the United States with a correlation coefficient (R) of -0.017 and weighted average of 5.7%, a difference of 8.0%.
Unemployment Among Women with Children Under 18 years Correlation Summary
| Measurement | Immigrants from Jordan | Armenian |
| Minimum | 1.1% | 1.5% |
| Maximum | 17.0% | 27.1% |
| Range | 15.9% | 25.6% |
| Mean | 6.1% | 6.6% |
| Median | 4.9% | 5.8% |
| Interquartile 25% (IQ1) | 4.1% | 4.8% |
| Interquartile 75% (IQ3) | 7.4% | 7.4% |
| Interquartile Range (IQR) | 3.3% | 2.6% |
| Standard Deviation (Sample) | 3.9% | 4.1% |
| Standard Deviation (Population) | 3.9% | 4.0% |
Similar Demographics by Unemployment Among Women with Children Under 18 years
Demographics Similar to Immigrants from Jordan by Unemployment Among Women with Children Under 18 years
In terms of unemployment among women with children under 18 years, the demographic groups most similar to Immigrants from Jordan are New Zealander (5.3%, a difference of 0.050%), Jordanian (5.3%, a difference of 0.070%), Argentinean (5.3%, a difference of 0.080%), Immigrants from Ukraine (5.3%, a difference of 0.11%), and Slovak (5.3%, a difference of 0.12%).
| Demographics | Rating | Rank | Unemployment Among Women with Children Under 18 years |
| Immigrants | Italy | 82.3 /100 | #129 | Excellent 5.3% |
| Immigrants | Austria | 82.1 /100 | #130 | Excellent 5.3% |
| Immigrants | Israel | 81.9 /100 | #131 | Excellent 5.3% |
| Immigrants | Ethiopia | 81.4 /100 | #132 | Excellent 5.3% |
| Ethiopians | 80.7 /100 | #133 | Excellent 5.3% |
| Slovaks | 80.5 /100 | #134 | Excellent 5.3% |
| New Zealanders | 79.9 /100 | #135 | Good 5.3% |
| Immigrants | Jordan | 79.5 /100 | #136 | Good 5.3% |
| Jordanians | 78.8 /100 | #137 | Good 5.3% |
| Argentineans | 78.8 /100 | #138 | Good 5.3% |
| Immigrants | Ukraine | 78.5 /100 | #139 | Good 5.3% |
| Immigrants | Norway | 76.2 /100 | #140 | Good 5.3% |
| Venezuelans | 76.0 /100 | #141 | Good 5.3% |
| Immigrants | Venezuela | 75.4 /100 | #142 | Good 5.3% |
| Chileans | 75.0 /100 | #143 | Good 5.3% |
Demographics Similar to Armenians by Unemployment Among Women with Children Under 18 years
In terms of unemployment among women with children under 18 years, the demographic groups most similar to Armenians are Immigrants from Syria (5.7%, a difference of 0.050%), Cherokee (5.7%, a difference of 0.070%), Potawatomi (5.7%, a difference of 0.19%), Osage (5.7%, a difference of 0.21%), and Sierra Leonean (5.8%, a difference of 0.27%).
| Demographics | Rating | Rank | Unemployment Among Women with Children Under 18 years |
| Immigrants | Nicaragua | 7.0 /100 | #218 | Tragic 5.7% |
| Iroquois | 6.5 /100 | #219 | Tragic 5.7% |
| Immigrants | Fiji | 6.3 /100 | #220 | Tragic 5.7% |
| Pennsylvania Germans | 5.7 /100 | #221 | Tragic 5.7% |
| Osage | 5.0 /100 | #222 | Tragic 5.7% |
| Potawatomi | 5.0 /100 | #223 | Tragic 5.7% |
| Immigrants | Syria | 4.6 /100 | #224 | Tragic 5.7% |
| Armenians | 4.5 /100 | #225 | Tragic 5.7% |
| Cherokee | 4.3 /100 | #226 | Tragic 5.7% |
| Sierra Leoneans | 3.8 /100 | #227 | Tragic 5.8% |
| Somalis | 3.5 /100 | #228 | Tragic 5.8% |
| Immigrants | Panama | 3.4 /100 | #229 | Tragic 5.8% |
| Immigrants | South America | 3.2 /100 | #230 | Tragic 5.8% |
| Immigrants | Africa | 3.1 /100 | #231 | Tragic 5.8% |
| Creek | 3.1 /100 | #232 | Tragic 5.8% |