Immigrants from Jordan vs Cajun Hearing Disability
COMPARE
Immigrants from Jordan
Cajun
Hearing Disability
Hearing Disability Comparison
Immigrants from Jordan
Cajuns
2.9%
HEARING DISABILITY
83.7/ 100
METRIC RATING
140th/ 347
METRIC RANK
3.9%
HEARING DISABILITY
0.0/ 100
METRIC RATING
312th/ 347
METRIC RANK
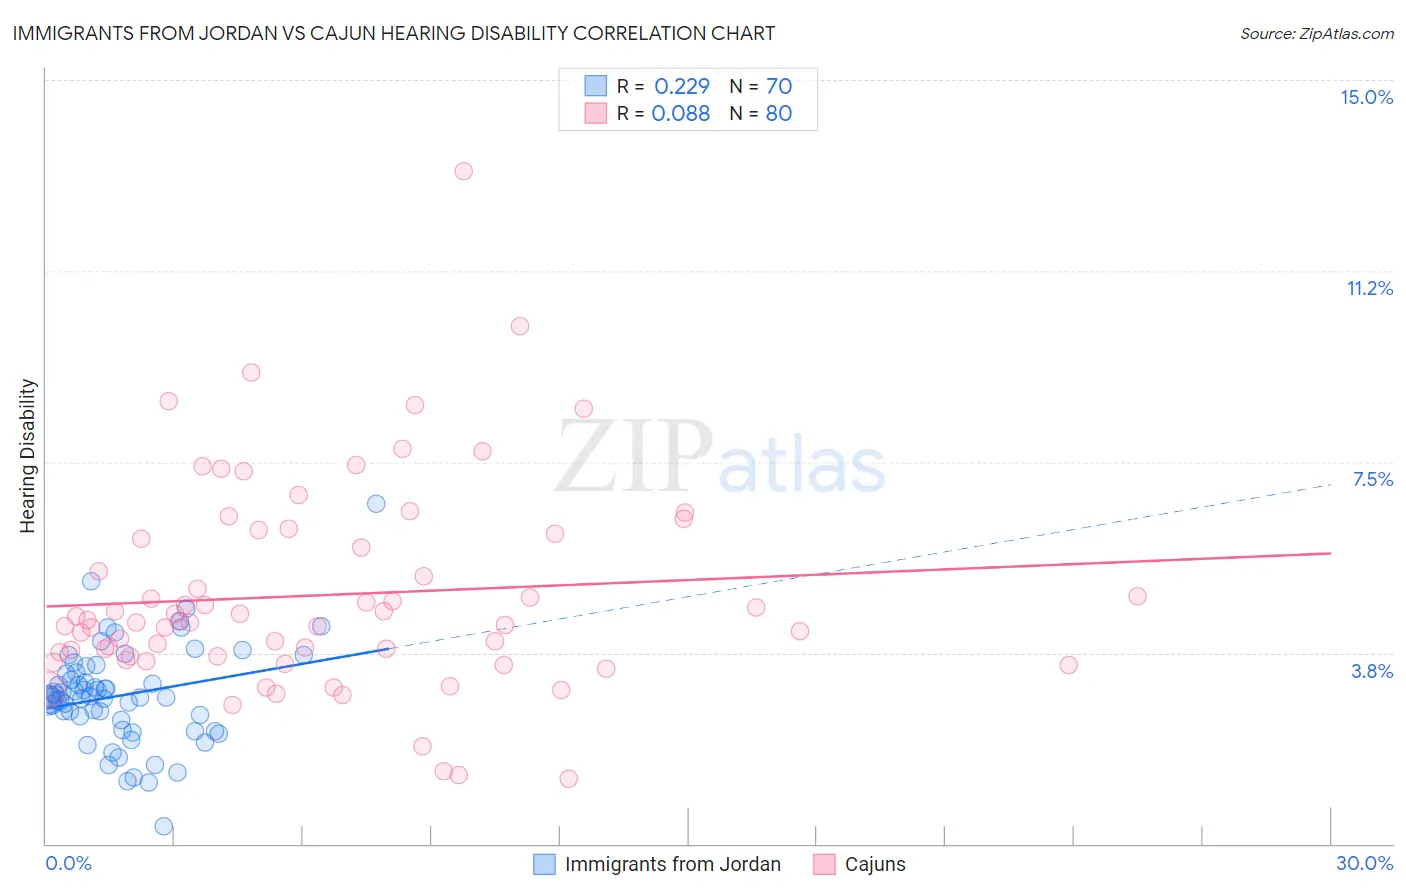
Immigrants from Jordan vs Cajun Hearing Disability Correlation Chart
The statistical analysis conducted on geographies consisting of 181,270,296 people shows a weak positive correlation between the proportion of Immigrants from Jordan and percentage of population with hearing disability in the United States with a correlation coefficient (R) of 0.229 and weighted average of 2.9%. Similarly, the statistical analysis conducted on geographies consisting of 149,694,482 people shows a slight positive correlation between the proportion of Cajuns and percentage of population with hearing disability in the United States with a correlation coefficient (R) of 0.088 and weighted average of 3.9%, a difference of 36.7%.
Hearing Disability Correlation Summary
| Measurement | Immigrants from Jordan | Cajun |
| Minimum | 0.34% | 1.3% |
| Maximum | 6.7% | 13.2% |
| Range | 6.3% | 11.9% |
| Mean | 2.9% | 4.9% |
| Median | 2.9% | 4.4% |
| Interquartile 25% (IQ1) | 2.4% | 3.7% |
| Interquartile 75% (IQ3) | 3.4% | 6.0% |
| Interquartile Range (IQR) | 0.92% | 2.4% |
| Standard Deviation (Sample) | 0.99% | 2.0% |
| Standard Deviation (Population) | 0.98% | 2.0% |
Similar Demographics by Hearing Disability
Demographics Similar to Immigrants from Jordan by Hearing Disability
In terms of hearing disability, the demographic groups most similar to Immigrants from Jordan are Bermudan (2.9%, a difference of 0.020%), Immigrants from Costa Rica (2.9%, a difference of 0.060%), Sri Lankan (2.9%, a difference of 0.070%), Subsaharan African (2.9%, a difference of 0.070%), and Immigrants from Brazil (2.9%, a difference of 0.17%).
| Demographics | Rating | Rank | Hearing Disability |
| Immigrants | Syria | 85.8 /100 | #133 | Excellent 2.9% |
| Ugandans | 85.5 /100 | #134 | Excellent 2.9% |
| Soviet Union | 84.8 /100 | #135 | Excellent 2.9% |
| Immigrants | Brazil | 84.6 /100 | #136 | Excellent 2.9% |
| Sri Lankans | 84.1 /100 | #137 | Excellent 2.9% |
| Immigrants | Costa Rica | 84.0 /100 | #138 | Excellent 2.9% |
| Bermudans | 83.8 /100 | #139 | Excellent 2.9% |
| Immigrants | Jordan | 83.7 /100 | #140 | Excellent 2.9% |
| Sub-Saharan Africans | 83.3 /100 | #141 | Excellent 2.9% |
| Laotians | 81.1 /100 | #142 | Excellent 2.9% |
| Immigrants | Bahamas | 80.9 /100 | #143 | Excellent 2.9% |
| Immigrants | Bulgaria | 79.2 /100 | #144 | Good 2.9% |
| Immigrants | Congo | 78.9 /100 | #145 | Good 2.9% |
| Brazilians | 78.7 /100 | #146 | Good 2.9% |
| Tongans | 78.6 /100 | #147 | Good 2.9% |
Demographics Similar to Cajuns by Hearing Disability
In terms of hearing disability, the demographic groups most similar to Cajuns are Hopi (3.9%, a difference of 0.11%), Yakama (3.9%, a difference of 0.28%), Puget Sound Salish (3.9%, a difference of 0.29%), Spanish American (4.0%, a difference of 0.49%), and Comanche (4.0%, a difference of 0.62%).
| Demographics | Rating | Rank | Hearing Disability |
| English | 0.0 /100 | #305 | Tragic 3.8% |
| Marshallese | 0.0 /100 | #306 | Tragic 3.8% |
| French Canadians | 0.0 /100 | #307 | Tragic 3.8% |
| Ottawa | 0.0 /100 | #308 | Tragic 3.8% |
| Scotch-Irish | 0.0 /100 | #309 | Tragic 3.8% |
| Cree | 0.0 /100 | #310 | Tragic 3.8% |
| Americans | 0.0 /100 | #311 | Tragic 3.9% |
| Cajuns | 0.0 /100 | #312 | Tragic 3.9% |
| Hopi | 0.0 /100 | #313 | Tragic 3.9% |
| Yakama | 0.0 /100 | #314 | Tragic 3.9% |
| Puget Sound Salish | 0.0 /100 | #315 | Tragic 3.9% |
| Spanish Americans | 0.0 /100 | #316 | Tragic 4.0% |
| Comanche | 0.0 /100 | #317 | Tragic 4.0% |
| Cheyenne | 0.0 /100 | #318 | Tragic 4.0% |
| Chippewa | 0.0 /100 | #319 | Tragic 4.0% |