Immigrants from Japan vs Alsatian 4th Grade
COMPARE
Immigrants from Japan
Alsatian
4th Grade
4th Grade Comparison
Immigrants from Japan
Alsatians
97.8%
4TH GRADE
94.1/ 100
METRIC RATING
122nd/ 347
METRIC RANK
97.6%
4TH GRADE
77.2/ 100
METRIC RATING
151st/ 347
METRIC RANK
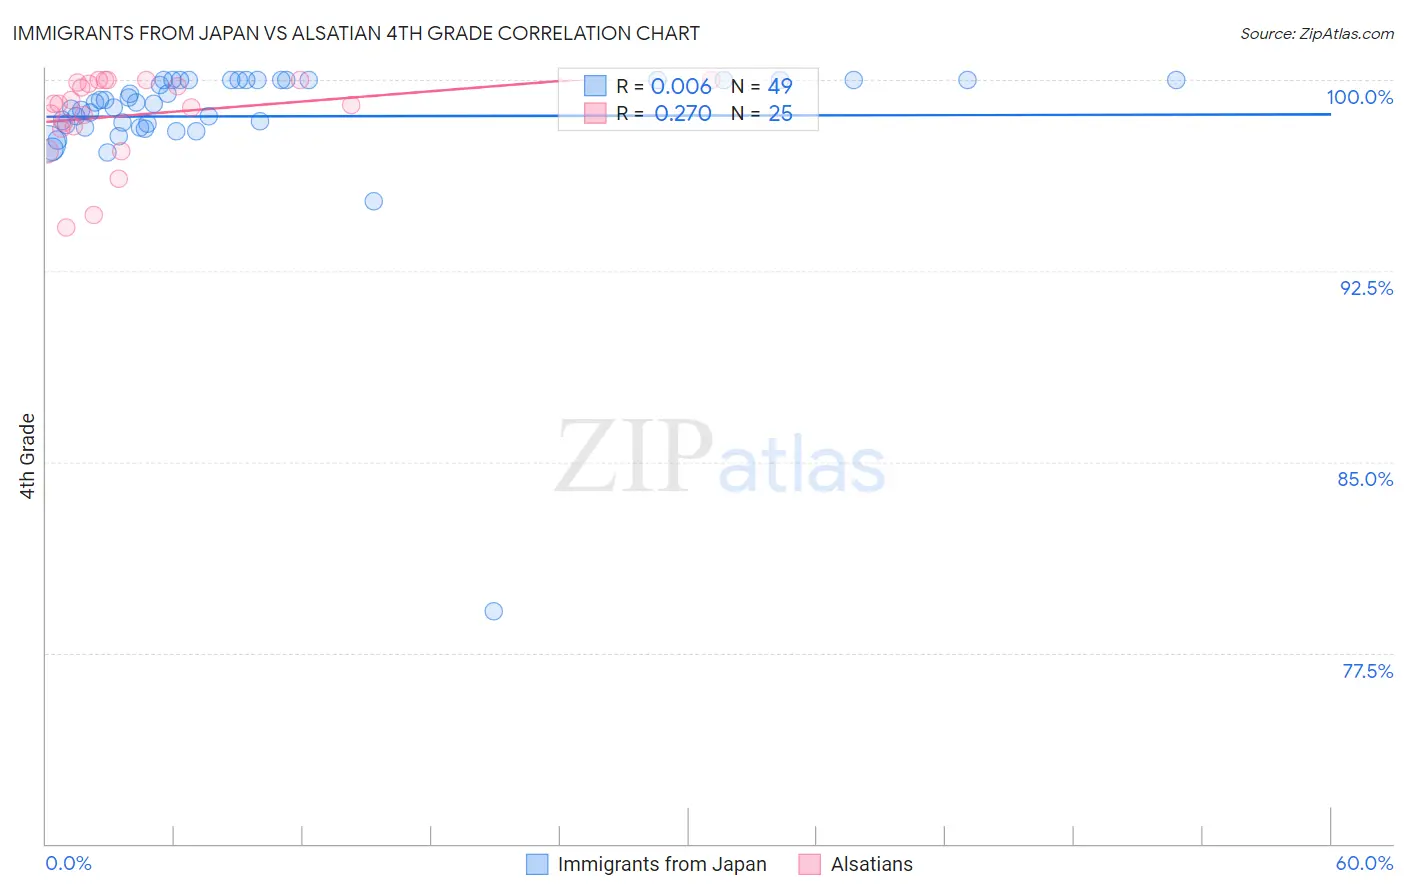
Immigrants from Japan vs Alsatian 4th Grade Correlation Chart
The statistical analysis conducted on geographies consisting of 340,148,942 people shows no correlation between the proportion of Immigrants from Japan and percentage of population with at least 4th grade education in the United States with a correlation coefficient (R) of 0.006 and weighted average of 97.8%. Similarly, the statistical analysis conducted on geographies consisting of 82,682,365 people shows a weak positive correlation between the proportion of Alsatians and percentage of population with at least 4th grade education in the United States with a correlation coefficient (R) of 0.270 and weighted average of 97.6%, a difference of 0.15%.
4th Grade Correlation Summary
| Measurement | Immigrants from Japan | Alsatian |
| Minimum | 79.1% | 94.2% |
| Maximum | 100.0% | 100.0% |
| Range | 20.9% | 5.8% |
| Mean | 98.6% | 98.6% |
| Median | 99.1% | 99.1% |
| Interquartile 25% (IQ1) | 98.2% | 98.1% |
| Interquartile 75% (IQ3) | 100.0% | 100.0% |
| Interquartile Range (IQR) | 1.8% | 1.8% |
| Standard Deviation (Sample) | 3.0% | 1.6% |
| Standard Deviation (Population) | 3.0% | 1.6% |
Similar Demographics by 4th Grade
Demographics Similar to Immigrants from Japan by 4th Grade
In terms of 4th grade, the demographic groups most similar to Immigrants from Japan are Immigrants from Norway (97.8%, a difference of 0.0%), Immigrants from Zimbabwe (97.8%, a difference of 0.0%), Syrian (97.8%, a difference of 0.010%), Menominee (97.8%, a difference of 0.010%), and Immigrants from Saudi Arabia (97.8%, a difference of 0.010%).
| Demographics | Rating | Rank | 4th Grade |
| Lebanese | 95.4 /100 | #115 | Exceptional 97.8% |
| Immigrants | Croatia | 95.2 /100 | #116 | Exceptional 97.8% |
| Syrians | 94.9 /100 | #117 | Exceptional 97.8% |
| Menominee | 94.9 /100 | #118 | Exceptional 97.8% |
| Immigrants | Saudi Arabia | 94.8 /100 | #119 | Exceptional 97.8% |
| Immigrants | France | 94.8 /100 | #120 | Exceptional 97.8% |
| Immigrants | Norway | 94.2 /100 | #121 | Exceptional 97.8% |
| Immigrants | Japan | 94.1 /100 | #122 | Exceptional 97.8% |
| Immigrants | Zimbabwe | 93.9 /100 | #123 | Exceptional 97.8% |
| Spanish | 93.7 /100 | #124 | Exceptional 97.8% |
| Immigrants | Serbia | 92.6 /100 | #125 | Exceptional 97.8% |
| Immigrants | Europe | 92.5 /100 | #126 | Exceptional 97.8% |
| Colville | 92.3 /100 | #127 | Exceptional 97.7% |
| Pima | 92.0 /100 | #128 | Exceptional 97.7% |
| Immigrants | Bulgaria | 91.3 /100 | #129 | Exceptional 97.7% |
Demographics Similar to Alsatians by 4th Grade
In terms of 4th grade, the demographic groups most similar to Alsatians are Soviet Union (97.6%, a difference of 0.0%), Immigrants from Israel (97.6%, a difference of 0.0%), Immigrants from South Central Asia (97.6%, a difference of 0.010%), Jordanian (97.7%, a difference of 0.020%), and Ute (97.7%, a difference of 0.020%).
| Demographics | Rating | Rank | 4th Grade |
| Spaniards | 82.7 /100 | #144 | Excellent 97.7% |
| Immigrants | Moldova | 82.4 /100 | #145 | Excellent 97.7% |
| Jordanians | 81.3 /100 | #146 | Excellent 97.7% |
| Ute | 80.6 /100 | #147 | Excellent 97.7% |
| Hopi | 80.6 /100 | #148 | Excellent 97.7% |
| Soviet Union | 77.8 /100 | #149 | Good 97.6% |
| Immigrants | Israel | 77.7 /100 | #150 | Good 97.6% |
| Alsatians | 77.2 /100 | #151 | Good 97.6% |
| Immigrants | South Central Asia | 76.2 /100 | #152 | Good 97.6% |
| Immigrants | Eastern Europe | 71.3 /100 | #153 | Good 97.6% |
| Immigrants | Russia | 67.0 /100 | #154 | Good 97.6% |
| Albanians | 67.0 /100 | #155 | Good 97.6% |
| Immigrants | Jordan | 66.9 /100 | #156 | Good 97.6% |
| Immigrants | Bosnia and Herzegovina | 66.0 /100 | #157 | Good 97.6% |
| French American Indians | 65.9 /100 | #158 | Good 97.6% |