Immigrants from Jamaica vs Albanian Ambulatory Disability
COMPARE
Immigrants from Jamaica
Albanian
Ambulatory Disability
Ambulatory Disability Comparison
Immigrants from Jamaica
Albanians
6.8%
AMBULATORY DISABILITY
0.0/ 100
METRIC RATING
284th/ 347
METRIC RANK
6.2%
AMBULATORY DISABILITY
19.7/ 100
METRIC RATING
202nd/ 347
METRIC RANK
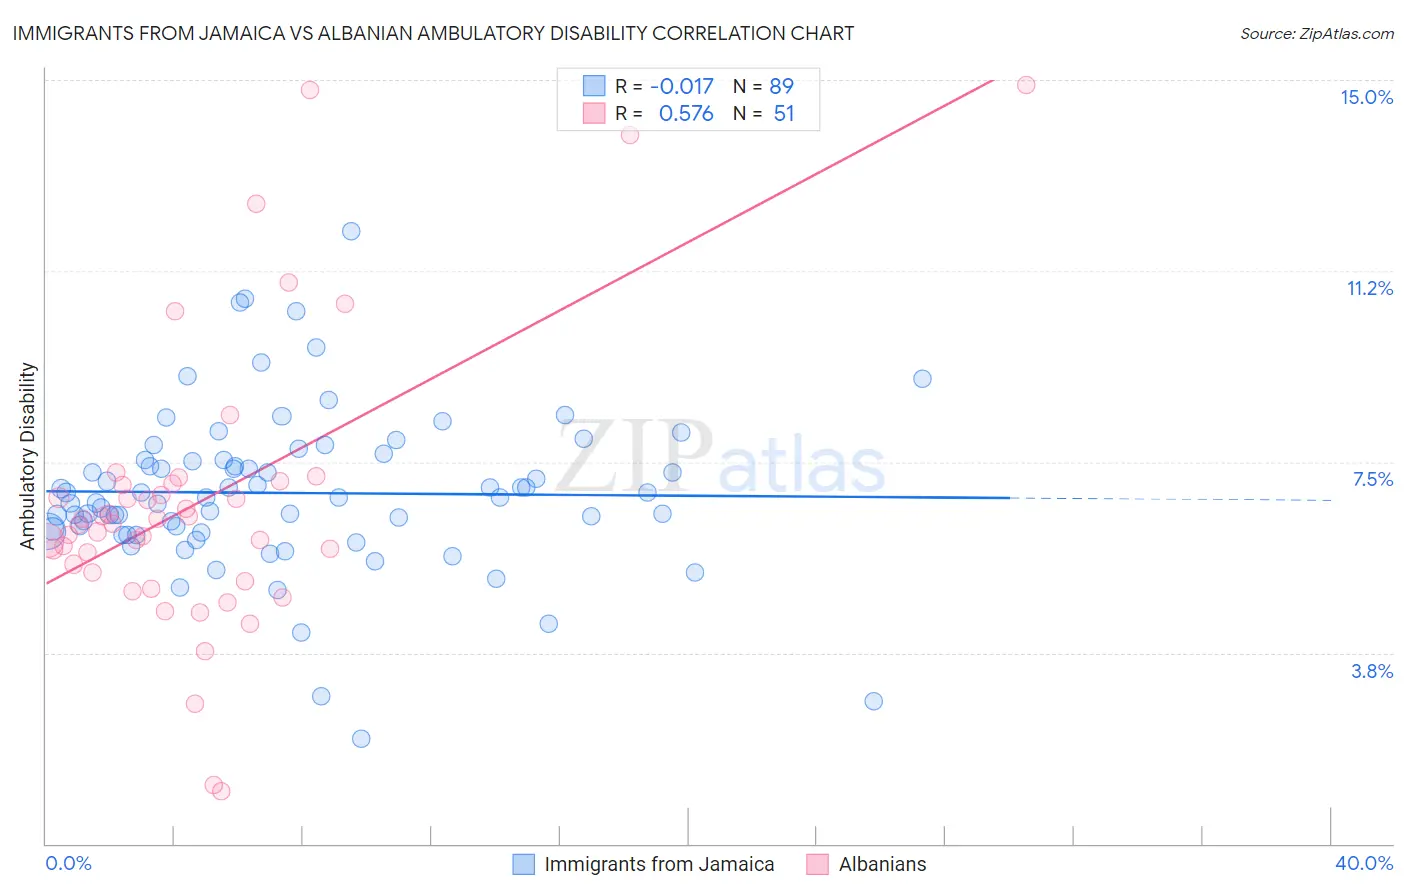
Immigrants from Jamaica vs Albanian Ambulatory Disability Correlation Chart
The statistical analysis conducted on geographies consisting of 301,698,027 people shows no correlation between the proportion of Immigrants from Jamaica and percentage of population with ambulatory disability in the United States with a correlation coefficient (R) of -0.017 and weighted average of 6.8%. Similarly, the statistical analysis conducted on geographies consisting of 193,248,883 people shows a substantial positive correlation between the proportion of Albanians and percentage of population with ambulatory disability in the United States with a correlation coefficient (R) of 0.576 and weighted average of 6.2%, a difference of 8.8%.
Ambulatory Disability Correlation Summary
| Measurement | Immigrants from Jamaica | Albanian |
| Minimum | 2.1% | 1.0% |
| Maximum | 12.0% | 14.9% |
| Range | 10.0% | 13.9% |
| Mean | 6.9% | 6.7% |
| Median | 6.8% | 6.3% |
| Interquartile 25% (IQ1) | 6.1% | 5.3% |
| Interquartile 75% (IQ3) | 7.5% | 7.1% |
| Interquartile Range (IQR) | 1.4% | 1.7% |
| Standard Deviation (Sample) | 1.6% | 2.8% |
| Standard Deviation (Population) | 1.6% | 2.8% |
Similar Demographics by Ambulatory Disability
Demographics Similar to Immigrants from Jamaica by Ambulatory Disability
In terms of ambulatory disability, the demographic groups most similar to Immigrants from Jamaica are Immigrants from Barbados (6.8%, a difference of 0.070%), Barbadian (6.8%, a difference of 0.23%), Yaqui (6.8%, a difference of 0.35%), Fijian (6.8%, a difference of 0.41%), and Pennsylvania German (6.8%, a difference of 0.42%).
| Demographics | Rating | Rank | Ambulatory Disability |
| Jamaicans | 0.1 /100 | #277 | Tragic 6.7% |
| Immigrants | West Indies | 0.1 /100 | #278 | Tragic 6.7% |
| Immigrants | Caribbean | 0.0 /100 | #279 | Tragic 6.7% |
| Pennsylvania Germans | 0.0 /100 | #280 | Tragic 6.8% |
| Yaqui | 0.0 /100 | #281 | Tragic 6.8% |
| Barbadians | 0.0 /100 | #282 | Tragic 6.8% |
| Immigrants | Barbados | 0.0 /100 | #283 | Tragic 6.8% |
| Immigrants | Jamaica | 0.0 /100 | #284 | Tragic 6.8% |
| Fijians | 0.0 /100 | #285 | Tragic 6.8% |
| Yakama | 0.0 /100 | #286 | Tragic 6.8% |
| U.S. Virgin Islanders | 0.0 /100 | #287 | Tragic 6.8% |
| Immigrants | Nonimmigrants | 0.0 /100 | #288 | Tragic 6.9% |
| Immigrants | Dominica | 0.0 /100 | #289 | Tragic 6.9% |
| Scotch-Irish | 0.0 /100 | #290 | Tragic 6.9% |
| West Indians | 0.0 /100 | #291 | Tragic 6.9% |
Demographics Similar to Albanians by Ambulatory Disability
In terms of ambulatory disability, the demographic groups most similar to Albanians are Immigrants from Central America (6.2%, a difference of 0.030%), Immigrants from Ukraine (6.2%, a difference of 0.11%), Immigrants from Congo (6.2%, a difference of 0.13%), Immigrants from Cambodia (6.2%, a difference of 0.14%), and Slovene (6.2%, a difference of 0.15%).
| Demographics | Rating | Rank | Ambulatory Disability |
| Belgians | 28.6 /100 | #195 | Fair 6.2% |
| Malaysians | 28.2 /100 | #196 | Fair 6.2% |
| Poles | 26.3 /100 | #197 | Fair 6.2% |
| Immigrants | Bangladesh | 24.6 /100 | #198 | Fair 6.2% |
| Italians | 22.6 /100 | #199 | Fair 6.2% |
| Immigrants | Cambodia | 21.5 /100 | #200 | Fair 6.2% |
| Immigrants | Central America | 20.1 /100 | #201 | Fair 6.2% |
| Albanians | 19.7 /100 | #202 | Poor 6.2% |
| Immigrants | Ukraine | 18.4 /100 | #203 | Poor 6.2% |
| Immigrants | Congo | 18.2 /100 | #204 | Poor 6.2% |
| Slovenes | 18.0 /100 | #205 | Poor 6.2% |
| Finns | 17.2 /100 | #206 | Poor 6.2% |
| Alsatians | 15.1 /100 | #207 | Poor 6.3% |
| Bangladeshis | 14.2 /100 | #208 | Poor 6.3% |
| Immigrants | Iraq | 14.0 /100 | #209 | Poor 6.3% |