Immigrants from Italy vs Immigrants from England Disability
COMPARE
Immigrants from Italy
Immigrants from England
Disability
Disability Comparison
Immigrants from Italy
Immigrants from England
11.4%
DISABILITY
90.4/ 100
METRIC RATING
127th/ 347
METRIC RANK
12.0%
DISABILITY
12.0/ 100
METRIC RATING
202nd/ 347
METRIC RANK
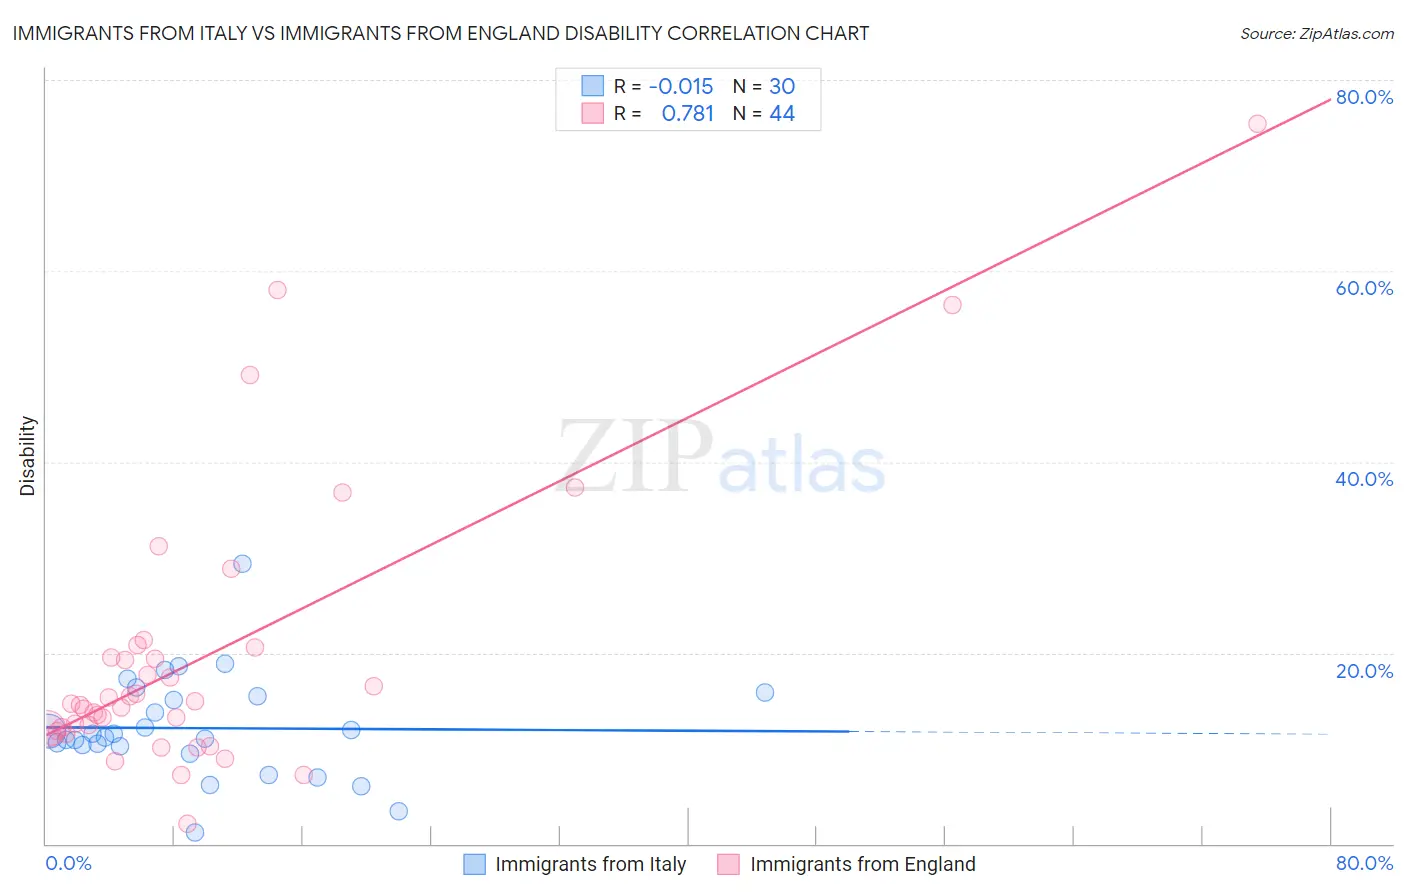
Immigrants from Italy vs Immigrants from England Disability Correlation Chart
The statistical analysis conducted on geographies consisting of 324,217,000 people shows no correlation between the proportion of Immigrants from Italy and percentage of population with a disability in the United States with a correlation coefficient (R) of -0.015 and weighted average of 11.4%. Similarly, the statistical analysis conducted on geographies consisting of 391,892,712 people shows a strong positive correlation between the proportion of Immigrants from England and percentage of population with a disability in the United States with a correlation coefficient (R) of 0.781 and weighted average of 12.0%, a difference of 4.8%.
Disability Correlation Summary
| Measurement | Immigrants from Italy | Immigrants from England |
| Minimum | 1.2% | 2.1% |
| Maximum | 29.3% | 75.4% |
| Range | 28.1% | 73.3% |
| Mean | 12.1% | 19.7% |
| Median | 11.3% | 14.6% |
| Interquartile 25% (IQ1) | 10.2% | 11.9% |
| Interquartile 75% (IQ3) | 15.4% | 20.1% |
| Interquartile Range (IQR) | 5.2% | 8.1% |
| Standard Deviation (Sample) | 5.4% | 14.9% |
| Standard Deviation (Population) | 5.3% | 14.7% |
Similar Demographics by Disability
Demographics Similar to Immigrants from Italy by Disability
In terms of disability, the demographic groups most similar to Immigrants from Italy are Immigrants from Europe (11.4%, a difference of 0.0%), Macedonian (11.4%, a difference of 0.020%), Immigrants from Latvia (11.4%, a difference of 0.070%), Latvian (11.4%, a difference of 0.070%), and Immigrants from Croatia (11.4%, a difference of 0.080%).
| Demographics | Rating | Rank | Disability |
| Immigrants | North Macedonia | 93.5 /100 | #120 | Exceptional 11.4% |
| Immigrants | Costa Rica | 93.4 /100 | #121 | Exceptional 11.4% |
| Brazilians | 93.3 /100 | #122 | Exceptional 11.4% |
| South Africans | 92.3 /100 | #123 | Exceptional 11.4% |
| South American Indians | 92.2 /100 | #124 | Exceptional 11.4% |
| Costa Ricans | 91.9 /100 | #125 | Exceptional 11.4% |
| Immigrants | Latvia | 90.9 /100 | #126 | Exceptional 11.4% |
| Immigrants | Italy | 90.4 /100 | #127 | Exceptional 11.4% |
| Immigrants | Europe | 90.4 /100 | #128 | Exceptional 11.4% |
| Macedonians | 90.3 /100 | #129 | Exceptional 11.4% |
| Latvians | 89.8 /100 | #130 | Excellent 11.4% |
| Immigrants | Croatia | 89.8 /100 | #131 | Excellent 11.4% |
| Immigrants | Africa | 89.3 /100 | #132 | Excellent 11.4% |
| Arabs | 89.1 /100 | #133 | Excellent 11.4% |
| Immigrants | Guyana | 88.3 /100 | #134 | Excellent 11.4% |
Demographics Similar to Immigrants from England by Disability
In terms of disability, the demographic groups most similar to Immigrants from England are British West Indian (12.0%, a difference of 0.050%), Mexican American Indian (12.0%, a difference of 0.050%), Assyrian/Chaldean/Syriac (11.9%, a difference of 0.070%), Belizean (11.9%, a difference of 0.090%), and Immigrants from Western Europe (12.0%, a difference of 0.21%).
| Demographics | Rating | Rank | Disability |
| Barbadians | 15.8 /100 | #195 | Poor 11.9% |
| Serbians | 15.4 /100 | #196 | Poor 11.9% |
| Immigrants | Belize | 15.2 /100 | #197 | Poor 11.9% |
| Ukrainians | 14.7 /100 | #198 | Poor 11.9% |
| Immigrants | Panama | 14.6 /100 | #199 | Poor 11.9% |
| Belizeans | 12.8 /100 | #200 | Poor 11.9% |
| Assyrians/Chaldeans/Syriacs | 12.6 /100 | #201 | Poor 11.9% |
| Immigrants | England | 12.0 /100 | #202 | Poor 12.0% |
| British West Indians | 11.5 /100 | #203 | Poor 12.0% |
| Mexican American Indians | 11.4 /100 | #204 | Poor 12.0% |
| Immigrants | Western Europe | 10.1 /100 | #205 | Poor 12.0% |
| Immigrants | Senegal | 9.4 /100 | #206 | Tragic 12.0% |
| Immigrants | Thailand | 9.3 /100 | #207 | Tragic 12.0% |
| Immigrants | Caribbean | 9.1 /100 | #208 | Tragic 12.0% |
| Danes | 8.7 /100 | #209 | Tragic 12.0% |