Immigrants from Ireland vs Uruguayan Divorced or Separated
COMPARE
Immigrants from Ireland
Uruguayan
Divorced or Separated
Divorced or Separated Comparison
Immigrants from Ireland
Uruguayans
11.0%
DIVORCED OR SEPARATED
100.0/ 100
METRIC RATING
30th/ 347
METRIC RANK
12.4%
DIVORCED OR SEPARATED
3.4/ 100
METRIC RATING
241st/ 347
METRIC RANK
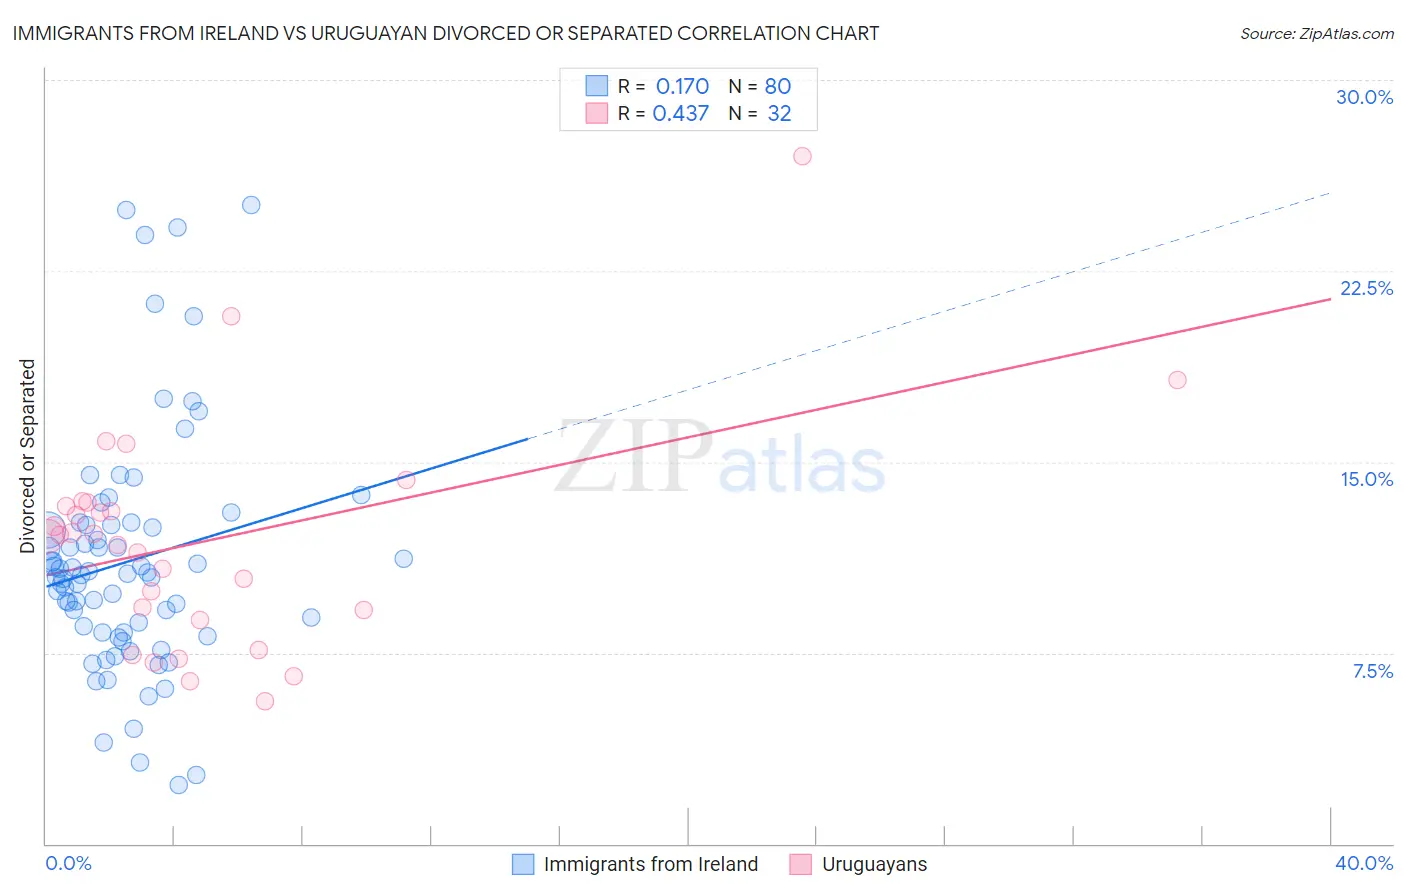
Immigrants from Ireland vs Uruguayan Divorced or Separated Correlation Chart
The statistical analysis conducted on geographies consisting of 240,767,381 people shows a poor positive correlation between the proportion of Immigrants from Ireland and percentage of population currently divorced or separated in the United States with a correlation coefficient (R) of 0.170 and weighted average of 11.0%. Similarly, the statistical analysis conducted on geographies consisting of 144,765,430 people shows a moderate positive correlation between the proportion of Uruguayans and percentage of population currently divorced or separated in the United States with a correlation coefficient (R) of 0.437 and weighted average of 12.4%, a difference of 12.4%.
Divorced or Separated Correlation Summary
| Measurement | Immigrants from Ireland | Uruguayan |
| Minimum | 2.3% | 5.6% |
| Maximum | 25.1% | 27.0% |
| Range | 22.8% | 21.4% |
| Mean | 11.1% | 11.9% |
| Median | 10.6% | 12.1% |
| Interquartile 25% (IQ1) | 8.3% | 9.0% |
| Interquartile 75% (IQ3) | 12.5% | 13.3% |
| Interquartile Range (IQR) | 4.2% | 4.3% |
| Standard Deviation (Sample) | 4.7% | 4.4% |
| Standard Deviation (Population) | 4.6% | 4.3% |
Similar Demographics by Divorced or Separated
Demographics Similar to Immigrants from Ireland by Divorced or Separated
In terms of divorced or separated, the demographic groups most similar to Immigrants from Ireland are Mongolian (11.1%, a difference of 0.30%), Tongan (11.1%, a difference of 0.37%), Egyptian (11.1%, a difference of 0.42%), Immigrants from Uzbekistan (11.1%, a difference of 0.49%), and Armenian (11.0%, a difference of 0.52%).
| Demographics | Rating | Rank | Divorced or Separated |
| Immigrants | Pakistan | 100.0 /100 | #23 | Exceptional 10.8% |
| Immigrants | Sri Lanka | 100.0 /100 | #24 | Exceptional 10.8% |
| Iranians | 100.0 /100 | #25 | Exceptional 10.8% |
| Immigrants | Indonesia | 100.0 /100 | #26 | Exceptional 10.9% |
| Immigrants | Bangladesh | 100.0 /100 | #27 | Exceptional 11.0% |
| Immigrants | Malaysia | 100.0 /100 | #28 | Exceptional 11.0% |
| Armenians | 100.0 /100 | #29 | Exceptional 11.0% |
| Immigrants | Ireland | 100.0 /100 | #30 | Exceptional 11.0% |
| Mongolians | 100.0 /100 | #31 | Exceptional 11.1% |
| Tongans | 100.0 /100 | #32 | Exceptional 11.1% |
| Egyptians | 100.0 /100 | #33 | Exceptional 11.1% |
| Immigrants | Uzbekistan | 100.0 /100 | #34 | Exceptional 11.1% |
| Cambodians | 100.0 /100 | #35 | Exceptional 11.1% |
| Immigrants | Japan | 100.0 /100 | #36 | Exceptional 11.1% |
| Immigrants | Lebanon | 100.0 /100 | #37 | Exceptional 11.1% |
Demographics Similar to Uruguayans by Divorced or Separated
In terms of divorced or separated, the demographic groups most similar to Uruguayans are British West Indian (12.4%, a difference of 0.090%), Dutch (12.4%, a difference of 0.090%), Immigrants from Germany (12.4%, a difference of 0.14%), Sudanese (12.4%, a difference of 0.15%), and Immigrants from Latin America (12.4%, a difference of 0.15%).
| Demographics | Rating | Rank | Divorced or Separated |
| West Indians | 4.4 /100 | #234 | Tragic 12.4% |
| Immigrants | Bosnia and Herzegovina | 4.3 /100 | #235 | Tragic 12.4% |
| Colombians | 4.2 /100 | #236 | Tragic 12.4% |
| Immigrants | Laos | 4.2 /100 | #237 | Tragic 12.4% |
| Sudanese | 4.0 /100 | #238 | Tragic 12.4% |
| Immigrants | Germany | 4.0 /100 | #239 | Tragic 12.4% |
| British West Indians | 3.7 /100 | #240 | Tragic 12.4% |
| Uruguayans | 3.4 /100 | #241 | Tragic 12.4% |
| Dutch | 3.1 /100 | #242 | Tragic 12.4% |
| Immigrants | Latin America | 2.8 /100 | #243 | Tragic 12.4% |
| Alaska Natives | 2.5 /100 | #244 | Tragic 12.4% |
| Hispanics or Latinos | 2.0 /100 | #245 | Tragic 12.5% |
| Immigrants | West Indies | 1.9 /100 | #246 | Tragic 12.5% |
| Germans | 1.8 /100 | #247 | Tragic 12.5% |
| Nepalese | 1.8 /100 | #248 | Tragic 12.5% |