Immigrants from the Azores vs Somali Cognitive Disability
COMPARE
Immigrants from the Azores
Somali
Cognitive Disability
Cognitive Disability Comparison
Immigrants from the Azores
Somalis
17.9%
COGNITIVE DISABILITY
0.6/ 100
METRIC RATING
255th/ 347
METRIC RANK
19.8%
COGNITIVE DISABILITY
0.0/ 100
METRIC RATING
345th/ 347
METRIC RANK
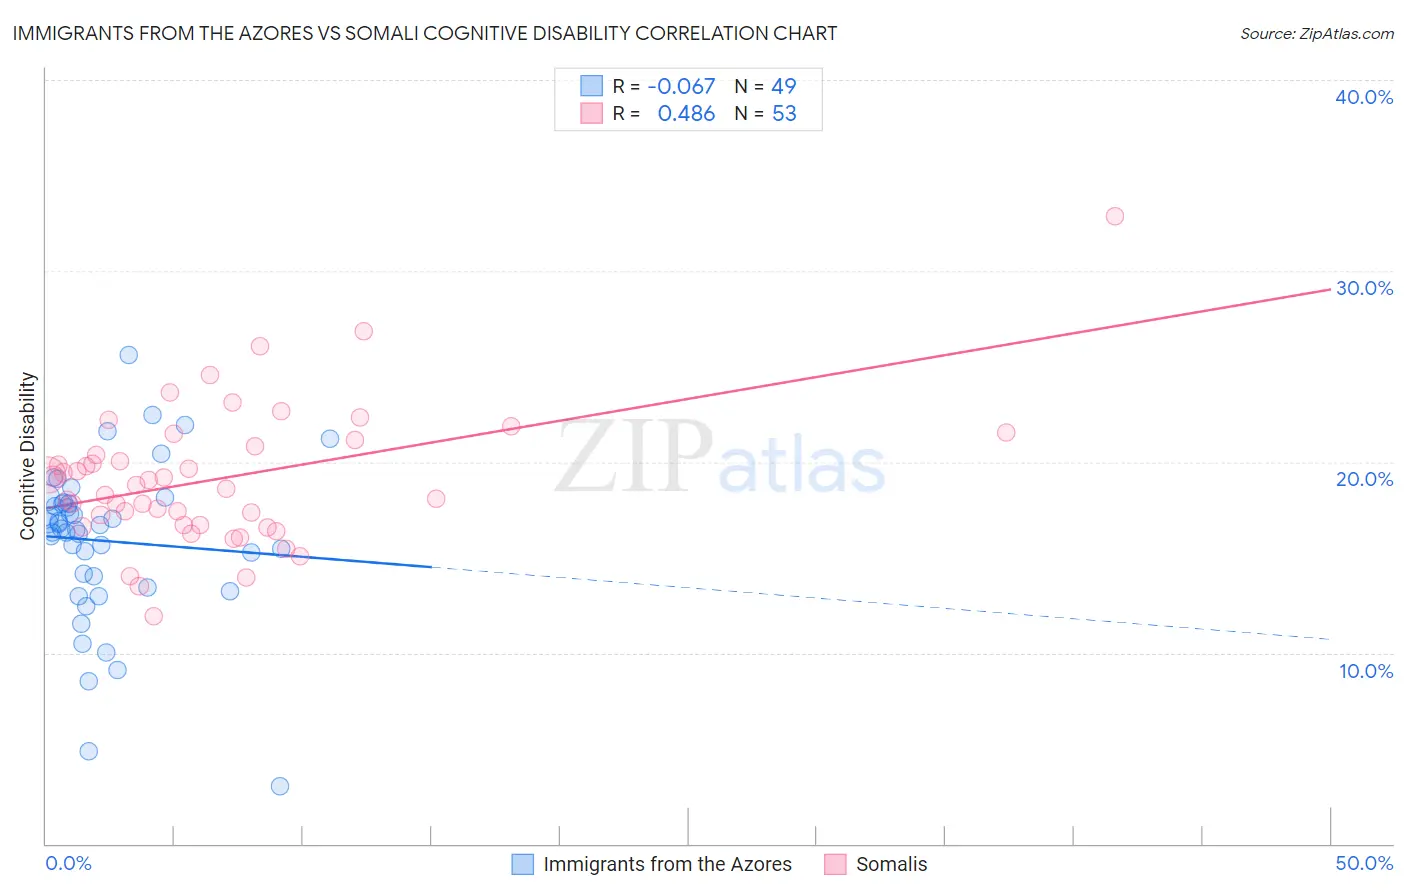
Immigrants from the Azores vs Somali Cognitive Disability Correlation Chart
The statistical analysis conducted on geographies consisting of 46,257,310 people shows a slight negative correlation between the proportion of Immigrants from the Azores and percentage of population with cognitive disability in the United States with a correlation coefficient (R) of -0.067 and weighted average of 17.9%. Similarly, the statistical analysis conducted on geographies consisting of 99,318,466 people shows a moderate positive correlation between the proportion of Somalis and percentage of population with cognitive disability in the United States with a correlation coefficient (R) of 0.486 and weighted average of 19.8%, a difference of 10.7%.
Cognitive Disability Correlation Summary
| Measurement | Immigrants from the Azores | Somali |
| Minimum | 3.0% | 11.9% |
| Maximum | 25.6% | 32.8% |
| Range | 22.6% | 20.9% |
| Mean | 15.9% | 19.1% |
| Median | 16.5% | 18.8% |
| Interquartile 25% (IQ1) | 13.7% | 16.7% |
| Interquartile 75% (IQ3) | 17.8% | 21.0% |
| Interquartile Range (IQR) | 4.1% | 4.3% |
| Standard Deviation (Sample) | 4.2% | 3.6% |
| Standard Deviation (Population) | 4.1% | 3.6% |
Similar Demographics by Cognitive Disability
Demographics Similar to Immigrants from the Azores by Cognitive Disability
In terms of cognitive disability, the demographic groups most similar to Immigrants from the Azores are Hispanic or Latino (17.9%, a difference of 0.0%), Bahamian (17.9%, a difference of 0.0%), Hopi (17.9%, a difference of 0.010%), Immigrants from Grenada (17.9%, a difference of 0.020%), and Malaysian (17.9%, a difference of 0.030%).
| Demographics | Rating | Rank | Cognitive Disability |
| French American Indians | 0.7 /100 | #248 | Tragic 17.9% |
| Cree | 0.7 /100 | #249 | Tragic 17.9% |
| Immigrants | Ethiopia | 0.7 /100 | #250 | Tragic 17.9% |
| Malaysians | 0.6 /100 | #251 | Tragic 17.9% |
| Immigrants | Grenada | 0.6 /100 | #252 | Tragic 17.9% |
| Hopi | 0.6 /100 | #253 | Tragic 17.9% |
| Hispanics or Latinos | 0.6 /100 | #254 | Tragic 17.9% |
| Immigrants | Azores | 0.6 /100 | #255 | Tragic 17.9% |
| Bahamians | 0.6 /100 | #256 | Tragic 17.9% |
| Mexican American Indians | 0.6 /100 | #257 | Tragic 17.9% |
| Immigrants | Armenia | 0.6 /100 | #258 | Tragic 17.9% |
| Ethiopians | 0.5 /100 | #259 | Tragic 17.9% |
| Immigrants | Belize | 0.5 /100 | #260 | Tragic 17.9% |
| Guamanians/Chamorros | 0.5 /100 | #261 | Tragic 17.9% |
| Sierra Leoneans | 0.4 /100 | #262 | Tragic 17.9% |
Demographics Similar to Somalis by Cognitive Disability
In terms of cognitive disability, the demographic groups most similar to Somalis are Immigrants from Cabo Verde (19.9%, a difference of 0.16%), Immigrants from Congo (19.7%, a difference of 0.56%), Immigrants from Somalia (20.0%, a difference of 0.89%), Immigrants from Zaire (19.4%, a difference of 2.2%), and Tohono O'odham (19.3%, a difference of 2.9%).
| Demographics | Rating | Rank | Cognitive Disability |
| Immigrants | Yemen | 0.0 /100 | #333 | Tragic 18.8% |
| Sudanese | 0.0 /100 | #334 | Tragic 18.9% |
| Senegalese | 0.0 /100 | #335 | Tragic 19.0% |
| Blacks/African Americans | 0.0 /100 | #336 | Tragic 19.0% |
| Immigrants | Saudi Arabia | 0.0 /100 | #337 | Tragic 19.1% |
| Lumbee | 0.0 /100 | #338 | Tragic 19.1% |
| Puerto Ricans | 0.0 /100 | #339 | Tragic 19.2% |
| Cape Verdeans | 0.0 /100 | #340 | Tragic 19.2% |
| Tohono O'odham | 0.0 /100 | #341 | Tragic 19.3% |
| Houma | 0.0 /100 | #342 | Tragic 19.3% |
| Immigrants | Zaire | 0.0 /100 | #343 | Tragic 19.4% |
| Immigrants | Congo | 0.0 /100 | #344 | Tragic 19.7% |
| Somalis | 0.0 /100 | #345 | Tragic 19.8% |
| Immigrants | Cabo Verde | 0.0 /100 | #346 | Tragic 19.9% |
| Immigrants | Somalia | 0.0 /100 | #347 | Tragic 20.0% |