Egyptian vs Immigrants from Nigeria Disability

COMPARE

Egyptian
Race
Ancestry
AfghanAfricanAlaska NativeAlaskan AthabascanAlbanianAleutAlsatianAmericanApacheArabArapahoArgentineanArmenianAssyrian/Chaldean/SyriacAustralianAustrianBahamianBangladeshiBarbadianBasqueBelgianBelizeanBermudanBhutaneseBlackfeetBolivianBrazilianBritishBritish West IndianBulgarianBurmeseCajunCambodianCanadianCape VerdeanCarpatho RusynCelticCentral AmericanCentral American IndianCherokeeCheyenneChickasawChileanChineseChippewaChoctawColombianColvilleComancheCosta RicanCreeCreekCroatianCrowCubanCypriotCzechCzechoslovakianDanishDelawareDominicanDutchDutch West IndianEastern EuropeanEcuadorianEgyptianEnglishEstonianEthiopianEuropeanFijianFilipinoFinnishFrenchFrench American IndianFrench CanadianGermanGerman RussianGhanaianGreekGuamanian/ChamorroGuatemalanGuyaneseHaitianHmongHonduranHopiHoumaHungarianIcelanderIndian (Asian)IndonesianInupiatIranianIraqiIrishIroquoisIsraeliItalianJamaicanJapaneseJordanianKenyanKiowaKoreanLaotianLatvianLebaneseLiberianLithuanianLumbeeLuxembourgerMacedonianMalaysianMalteseMarshalleseMenomineeMexicanMexican American IndianMongolianMoroccanNative HawaiianNavajoNepaleseNew ZealanderNicaraguanNigerianNorthern EuropeanNorwegianOkinawanOsageOttawaPaiutePakistaniPalestinianPanamanianParaguayanPennsylvania GermanPeruvianPimaPolishPortuguesePotawatomiPuebloPuerto RicanPuget Sound SalishRomanianRussianSalvadoranSamoanScandinavianScotch-IrishScottishSeminoleSenegaleseSerbianShoshoneSierra LeoneanSiouxSlavicSlovakSloveneSomaliSouth AfricanSouth AmericanSouth American IndianSoviet UnionSpaniardSpanishSpanish AmericanSpanish American IndianSri LankanSubsaharan AfricanSudaneseSwedishSwissSyrianTaiwaneseThaiTlingit-HaidaTohono O'OdhamTonganTrinidadian and TobagonianTsimshianTurkishU.S. Virgin IslanderUgandanUkrainianUruguayanUteVenezuelanVietnameseWelshWest IndianYakamaYaquiYugoslavianYumanYup'ikZimbabwean
Immigration
NonimmigrantsImmigrantsAfghanistanAfricaAlbaniaArgentinaArmeniaAsiaAustraliaAustriaBahamasBangladeshBarbadosBelarusBelgiumBelizeBoliviaBosnia and HerzegovinaBrazilBulgariaBurma/MyanmarCabo VerdeCambodiaCameroonCanadaCaribbeanCentral AmericaChileChinaColombiaCongoCosta RicaCroatiaCubaCzechoslovakiaDenmarkDominicaDominican RepublicEastern AfricaEastern AsiaEastern EuropeEcuadorEgyptEl SalvadorEnglandEritreaEthiopiaEuropeFijiFranceGermanyGhanaGreeceGrenadaGuatemalaGuyanaHaitiHondurasHong KongHungaryIndiaIndonesiaIranIraqIrelandIsraelItalyJamaicaJapanJordanKazakhstanKenyaKoreaKuwaitLaosLatin AmericaLatviaLebanonLiberiaLithuaniaMalaysiaMexicoMicronesiaMiddle AfricaMoldovaMoroccoNepalNetherlandsNicaraguaNorth AmericaNorth MacedoniaNorthern AfricaNorthern EuropeNorwayOceaniaPakistanPanamaPeruPhilippinesPolandPortugalRomaniaRussiaSaudi ArabiaScotlandSenegalSerbiaSierra LeoneSingaporeSomaliaSouth AfricaSouth AmericaSouth Central AsiaSouth Eastern AsiaSouthern EuropeSpainSri LankaSt. Vincent and the GrenadinesSudanSwedenSwitzerlandSyriaTaiwanThailandTrinidad and TobagoTurkeyUgandaUkraineUruguayUzbekistanVenezuelaVietnamWest IndiesWestern AfricaWestern AsiaWestern EuropeYemenZaireZimbabweAzores
Immigrants from Nigeria
Race
Ancestry
AfghanAfricanAlaska NativeAlaskan AthabascanAlbanianAleutAlsatianAmericanApacheArabArapahoArgentineanArmenianAssyrian/Chaldean/SyriacAustralianAustrianBahamianBangladeshiBarbadianBasqueBelgianBelizeanBermudanBhutaneseBlackfeetBolivianBrazilianBritishBritish West IndianBulgarianBurmeseCajunCambodianCanadianCape VerdeanCarpatho RusynCelticCentral AmericanCentral American IndianCherokeeCheyenneChickasawChileanChineseChippewaChoctawColombianColvilleComancheCosta RicanCreeCreekCroatianCrowCubanCypriotCzechCzechoslovakianDanishDelawareDominicanDutchDutch West IndianEastern EuropeanEcuadorianEnglishEstonianEthiopianEuropeanFijianFilipinoFinnishFrenchFrench American IndianFrench CanadianGermanGerman RussianGhanaianGreekGuamanian/ChamorroGuatemalanGuyaneseHaitianHmongHonduranHopiHoumaHungarianIcelanderIndian (Asian)IndonesianInupiatIranianIraqiIrishIroquoisIsraeliItalianJamaicanJapaneseJordanianKenyanKiowaKoreanLaotianLatvianLebaneseLiberianLithuanianLumbeeLuxembourgerMacedonianMalaysianMalteseMarshalleseMenomineeMexicanMexican American IndianMongolianMoroccanNative HawaiianNavajoNepaleseNew ZealanderNicaraguanNigerianNorthern EuropeanNorwegianOkinawanOsageOttawaPaiutePakistaniPalestinianPanamanianParaguayanPennsylvania GermanPeruvianPimaPolishPortuguesePotawatomiPuebloPuerto RicanPuget Sound SalishRomanianRussianSalvadoranSamoanScandinavianScotch-IrishScottishSeminoleSenegaleseSerbianShoshoneSierra LeoneanSiouxSlavicSlovakSloveneSomaliSouth AfricanSouth AmericanSouth American IndianSoviet UnionSpaniardSpanishSpanish AmericanSpanish American IndianSri LankanSubsaharan AfricanSudaneseSwedishSwissSyrianTaiwaneseThaiTlingit-HaidaTohono O'OdhamTonganTrinidadian and TobagonianTsimshianTurkishU.S. Virgin IslanderUgandanUkrainianUruguayanUteVenezuelanVietnameseWelshWest IndianYakamaYaquiYugoslavianYumanYup'ikZimbabwean
Immigration
NonimmigrantsImmigrantsAfghanistanAfricaAlbaniaArgentinaArmeniaAsiaAustraliaAustriaBahamasBangladeshBarbadosBelarusBelgiumBelizeBoliviaBosnia and HerzegovinaBrazilBulgariaBurma/MyanmarCabo VerdeCambodiaCameroonCanadaCaribbeanCentral AmericaChileChinaColombiaCongoCosta RicaCroatiaCubaCzechoslovakiaDenmarkDominicaDominican RepublicEastern AfricaEastern AsiaEastern EuropeEcuadorEgyptEl SalvadorEnglandEritreaEthiopiaEuropeFijiFranceGermanyGhanaGreeceGrenadaGuatemalaGuyanaHaitiHondurasHong KongHungaryIndiaIndonesiaIranIraqIrelandIsraelItalyJamaicaJapanJordanKazakhstanKenyaKoreaKuwaitLaosLatin AmericaLatviaLebanonLiberiaLithuaniaMalaysiaMexicoMicronesiaMiddle AfricaMoldovaMoroccoNepalNetherlandsNicaraguaNigeriaNorth AmericaNorth MacedoniaNorthern AfricaNorthern EuropeNorwayOceaniaPakistanPanamaPeruPhilippinesPolandPortugalRomaniaRussiaSaudi ArabiaScotlandSenegalSerbiaSierra LeoneSingaporeSomaliaSouth AfricaSouth AmericaSouth Central AsiaSouth Eastern AsiaSouthern EuropeSpainSri LankaSt. Vincent and the GrenadinesSudanSwedenSwitzerlandSyriaTaiwanThailandTrinidad and TobagoTurkeyUgandaUkraineUruguayUzbekistanVenezuelaVietnamWest IndiesWestern AfricaWestern AsiaWestern EuropeYemenZaireZimbabweAzores
Disability
Income
Poverty
Unemployment
Labor Participation
Family Structure
Vehicle Availability
Education Level
Disability

Disability Comparison

Egyptians

Immigrants from Nigeria

Exceptional
Exceptional
10.6%
DISABILITY
100.0/ 100
METRIC RATING
28th/ 347
METRIC RANK
11.3%
DISABILITY
96.0/ 100
METRIC RATING
108th/ 347
METRIC RANK

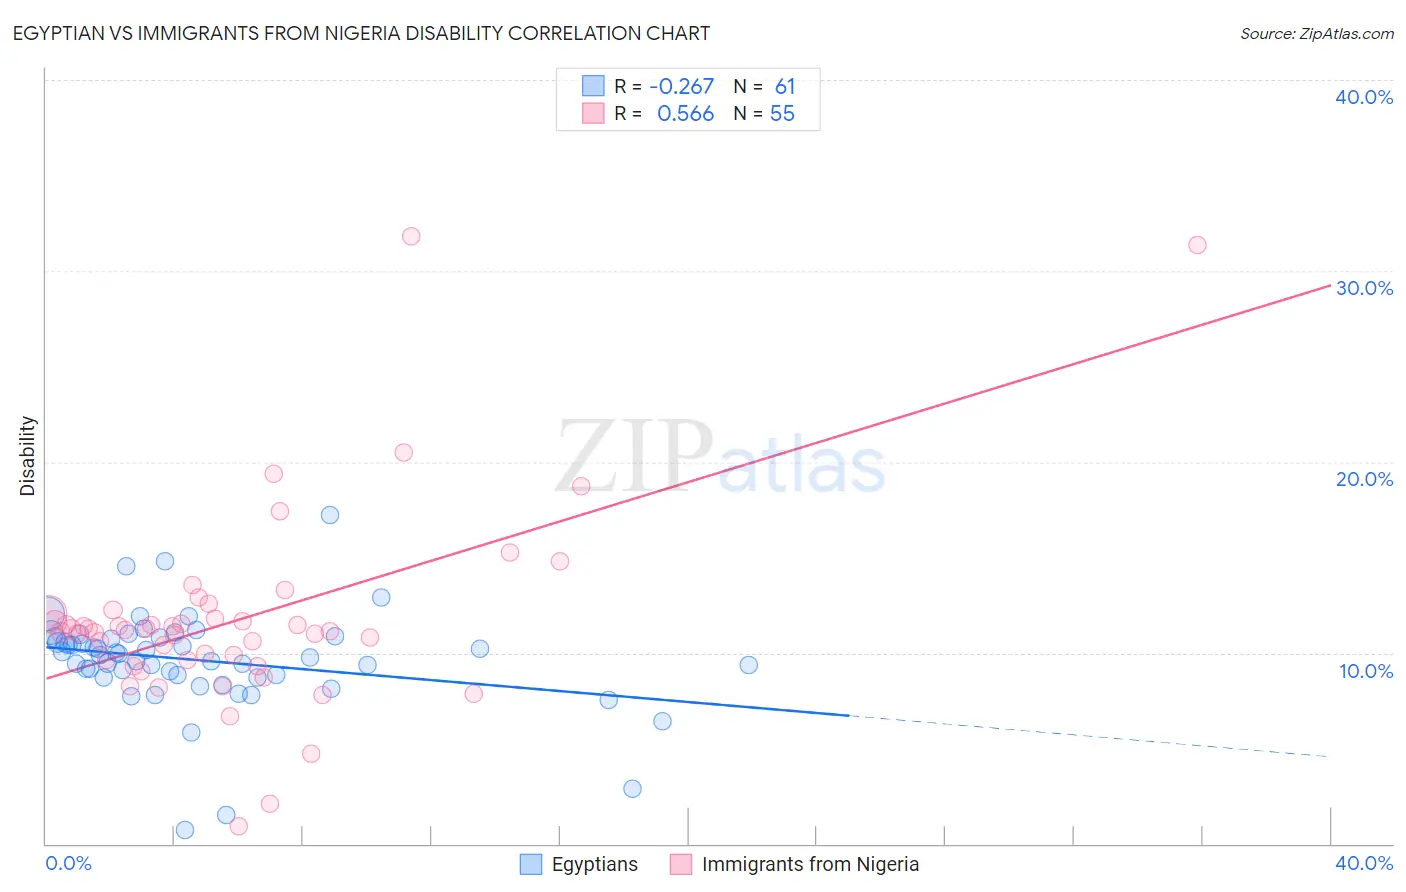
Egyptian vs Immigrants from Nigeria Disability Correlation Chart

The statistical analysis conducted on geographies consisting of 276,915,962 people shows a weak negative correlation between the proportion of Egyptians and percentage of population with a disability in the United States with a correlation coefficient (R) of -0.267 and weighted average of 10.6%. Similarly, the statistical analysis conducted on geographies consisting of 283,478,180 people shows a substantial positive correlation between the proportion of Immigrants from Nigeria and percentage of population with a disability in the United States with a correlation coefficient (R) of 0.566 and weighted average of 11.3%, a difference of 6.5%.
Egyptian vs Immigrants from Nigeria Disability

Disability Correlation Summary

MeasurementEgyptianImmigrants from Nigeria
Minimum0.75%0.93%
Maximum17.2%31.8%
Range16.5%30.9%
Mean9.6%11.7%
Median9.9%11.2%
Interquartile 25% (IQ1)8.8%9.6%
Interquartile 75% (IQ3)10.8%12.0%
Interquartile Range (IQR)2.0%2.4%
Standard Deviation (Sample)2.6%5.2%
Standard Deviation (Population)2.6%5.1%

Similar Demographics by Disability

Demographics Similar to Egyptians by Disability

In terms of disability, the demographic groups most similar to Egyptians are Cypriot (10.6%, a difference of 0.13%), Immigrants from Argentina (10.6%, a difference of 0.13%), Argentinean (10.6%, a difference of 0.14%), Immigrants from Malaysia (10.6%, a difference of 0.19%), and Immigrants from Turkey (10.6%, a difference of 0.28%).
DemographicsRating | RankDisability
Asians
100.0
/100
|
#21
Exceptional
10.4%
Immigrants | Sri Lanka
100.0
/100
|
#22
Exceptional
10.5%
Immigrants | Asia
100.0
/100
|
#23
Exceptional
10.5%
Venezuelans
100.0
/100
|
#24
Exceptional
10.5%
Immigrants | Malaysia
100.0
/100
|
#25
Exceptional
10.6%
Argentineans
100.0
/100
|
#26
Exceptional
10.6%
Cypriots
100.0
/100
|
#27
Exceptional
10.6%
Egyptians
100.0
/100
|
#28
Exceptional
10.6%
Immigrants | Argentina
100.0
/100
|
#29
Exceptional
10.6%
Immigrants | Turkey
100.0
/100
|
#30
Exceptional
10.6%
Immigrants | Egypt
100.0
/100
|
#31
Exceptional
10.6%
Paraguayans
100.0
/100
|
#32
Exceptional
10.6%
Immigrants | Kuwait
100.0
/100
|
#33
Exceptional
10.7%
Immigrants | Ethiopia
100.0
/100
|
#34
Exceptional
10.7%
Immigrants | Indonesia
100.0
/100
|
#35
Exceptional
10.7%

Demographics Similar to Immigrants from Nigeria by Disability

In terms of disability, the demographic groups most similar to Immigrants from Nigeria are Nicaraguan (11.3%, a difference of 0.080%), Immigrants from Uganda (11.3%, a difference of 0.080%), Immigrants from Eastern Europe (11.3%, a difference of 0.10%), Immigrants from Denmark (11.3%, a difference of 0.10%), and Immigrants from Kazakhstan (11.3%, a difference of 0.13%).
DemographicsRating | RankDisability
Immigrants | Nicaragua
96.8
/100
|
#101
Exceptional
11.3%
Immigrants | Eastern Africa
96.7
/100
|
#102
Exceptional
11.3%
Immigrants | Uruguay
96.4
/100
|
#103
Exceptional
11.3%
Immigrants | Immigrants
96.4
/100
|
#104
Exceptional
11.3%
Immigrants | Kazakhstan
96.4
/100
|
#105
Exceptional
11.3%
Immigrants | Eastern Europe
96.3
/100
|
#106
Exceptional
11.3%
Nicaraguans
96.2
/100
|
#107
Exceptional
11.3%
Immigrants | Nigeria
96.0
/100
|
#108
Exceptional
11.3%
Immigrants | Uganda
95.7
/100
|
#109
Exceptional
11.3%
Immigrants | Denmark
95.6
/100
|
#110
Exceptional
11.3%
Immigrants | South Eastern Asia
95.4
/100
|
#111
Exceptional
11.3%
Immigrants | Uzbekistan
94.9
/100
|
#112
Exceptional
11.3%
Guyanese
94.7
/100
|
#113
Exceptional
11.3%
Immigrants | Syria
94.7
/100
|
#114
Exceptional
11.3%
Immigrants | Philippines
94.6
/100
|
#115
Exceptional
11.3%