Guatemalan vs Immigrants from Nigeria Disability
COMPARE
Guatemalan
Immigrants from Nigeria
Disability
Disability Comparison
Guatemalans
Immigrants from Nigeria
11.6%
DISABILITY
65.1/ 100
METRIC RATING
159th/ 347
METRIC RANK
11.3%
DISABILITY
96.0/ 100
METRIC RATING
108th/ 347
METRIC RANK
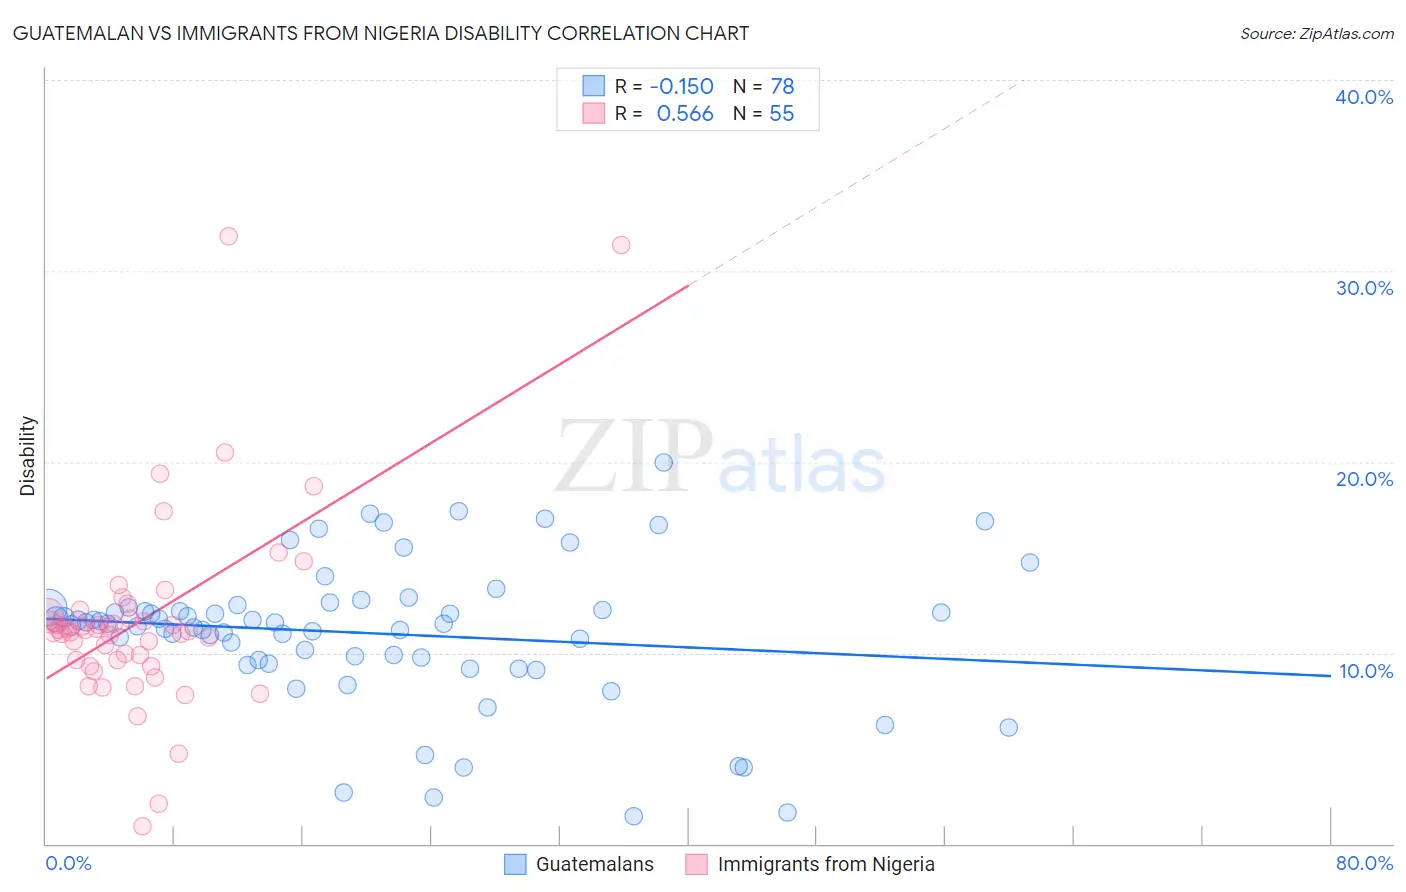
Guatemalan vs Immigrants from Nigeria Disability Correlation Chart
The statistical analysis conducted on geographies consisting of 409,499,513 people shows a poor negative correlation between the proportion of Guatemalans and percentage of population with a disability in the United States with a correlation coefficient (R) of -0.150 and weighted average of 11.6%. Similarly, the statistical analysis conducted on geographies consisting of 283,478,180 people shows a substantial positive correlation between the proportion of Immigrants from Nigeria and percentage of population with a disability in the United States with a correlation coefficient (R) of 0.566 and weighted average of 11.3%, a difference of 2.9%.
Disability Correlation Summary
| Measurement | Guatemalan | Immigrants from Nigeria |
| Minimum | 1.4% | 0.93% |
| Maximum | 20.0% | 31.8% |
| Range | 18.6% | 30.9% |
| Mean | 11.0% | 11.7% |
| Median | 11.5% | 11.2% |
| Interquartile 25% (IQ1) | 9.6% | 9.6% |
| Interquartile 75% (IQ3) | 12.4% | 12.0% |
| Interquartile Range (IQR) | 2.7% | 2.4% |
| Standard Deviation (Sample) | 3.7% | 5.2% |
| Standard Deviation (Population) | 3.7% | 5.1% |
Similar Demographics by Disability
Demographics Similar to Guatemalans by Disability
In terms of disability, the demographic groups most similar to Guatemalans are Armenian (11.6%, a difference of 0.040%), Immigrants from Barbados (11.6%, a difference of 0.040%), Immigrants from Cuba (11.6%, a difference of 0.11%), Immigrants from Middle Africa (11.6%, a difference of 0.22%), and Immigrants from Fiji (11.6%, a difference of 0.23%).
| Demographics | Rating | Rank | Disability |
| Immigrants | Moldova | 72.0 /100 | #152 | Good 11.6% |
| Immigrants | Ghana | 71.2 /100 | #153 | Good 11.6% |
| Immigrants | Guatemala | 71.1 /100 | #154 | Good 11.6% |
| Immigrants | Netherlands | 69.8 /100 | #155 | Good 11.6% |
| Immigrants | Fiji | 69.5 /100 | #156 | Good 11.6% |
| Immigrants | Middle Africa | 69.5 /100 | #157 | Good 11.6% |
| Armenians | 65.9 /100 | #158 | Good 11.6% |
| Guatemalans | 65.1 /100 | #159 | Good 11.6% |
| Immigrants | Barbados | 64.2 /100 | #160 | Good 11.6% |
| Immigrants | Cuba | 62.8 /100 | #161 | Good 11.6% |
| Immigrants | Haiti | 59.2 /100 | #162 | Average 11.7% |
| Immigrants | Trinidad and Tobago | 58.9 /100 | #163 | Average 11.7% |
| Syrians | 58.5 /100 | #164 | Average 11.7% |
| Cubans | 56.7 /100 | #165 | Average 11.7% |
| Pakistanis | 54.7 /100 | #166 | Average 11.7% |
Demographics Similar to Immigrants from Nigeria by Disability
In terms of disability, the demographic groups most similar to Immigrants from Nigeria are Nicaraguan (11.3%, a difference of 0.080%), Immigrants from Uganda (11.3%, a difference of 0.080%), Immigrants from Eastern Europe (11.3%, a difference of 0.10%), Immigrants from Denmark (11.3%, a difference of 0.10%), and Immigrants from Kazakhstan (11.3%, a difference of 0.13%).
| Demographics | Rating | Rank | Disability |
| Immigrants | Nicaragua | 96.8 /100 | #101 | Exceptional 11.3% |
| Immigrants | Eastern Africa | 96.7 /100 | #102 | Exceptional 11.3% |
| Immigrants | Uruguay | 96.4 /100 | #103 | Exceptional 11.3% |
| Immigrants | Immigrants | 96.4 /100 | #104 | Exceptional 11.3% |
| Immigrants | Kazakhstan | 96.4 /100 | #105 | Exceptional 11.3% |
| Immigrants | Eastern Europe | 96.3 /100 | #106 | Exceptional 11.3% |
| Nicaraguans | 96.2 /100 | #107 | Exceptional 11.3% |
| Immigrants | Nigeria | 96.0 /100 | #108 | Exceptional 11.3% |
| Immigrants | Uganda | 95.7 /100 | #109 | Exceptional 11.3% |
| Immigrants | Denmark | 95.6 /100 | #110 | Exceptional 11.3% |
| Immigrants | South Eastern Asia | 95.4 /100 | #111 | Exceptional 11.3% |
| Immigrants | Uzbekistan | 94.9 /100 | #112 | Exceptional 11.3% |
| Guyanese | 94.7 /100 | #113 | Exceptional 11.3% |
| Immigrants | Syria | 94.7 /100 | #114 | Exceptional 11.3% |
| Immigrants | Philippines | 94.6 /100 | #115 | Exceptional 11.3% |