Immigrants from Iran vs Immigrants from Yemen Unemployment Among Ages 45 to 54 years
COMPARE
Immigrants from Iran
Immigrants from Yemen
Unemployment Among Ages 45 to 54 years
Unemployment Among Ages 45 to 54 years Comparison
Immigrants from Iran
Immigrants from Yemen
4.6%
UNEMPLOYMENT AMONG AGES 45 TO 54 YEARS
11.5/ 100
METRIC RATING
212th/ 347
METRIC RANK
6.5%
UNEMPLOYMENT AMONG AGES 45 TO 54 YEARS
0.0/ 100
METRIC RATING
333rd/ 347
METRIC RANK
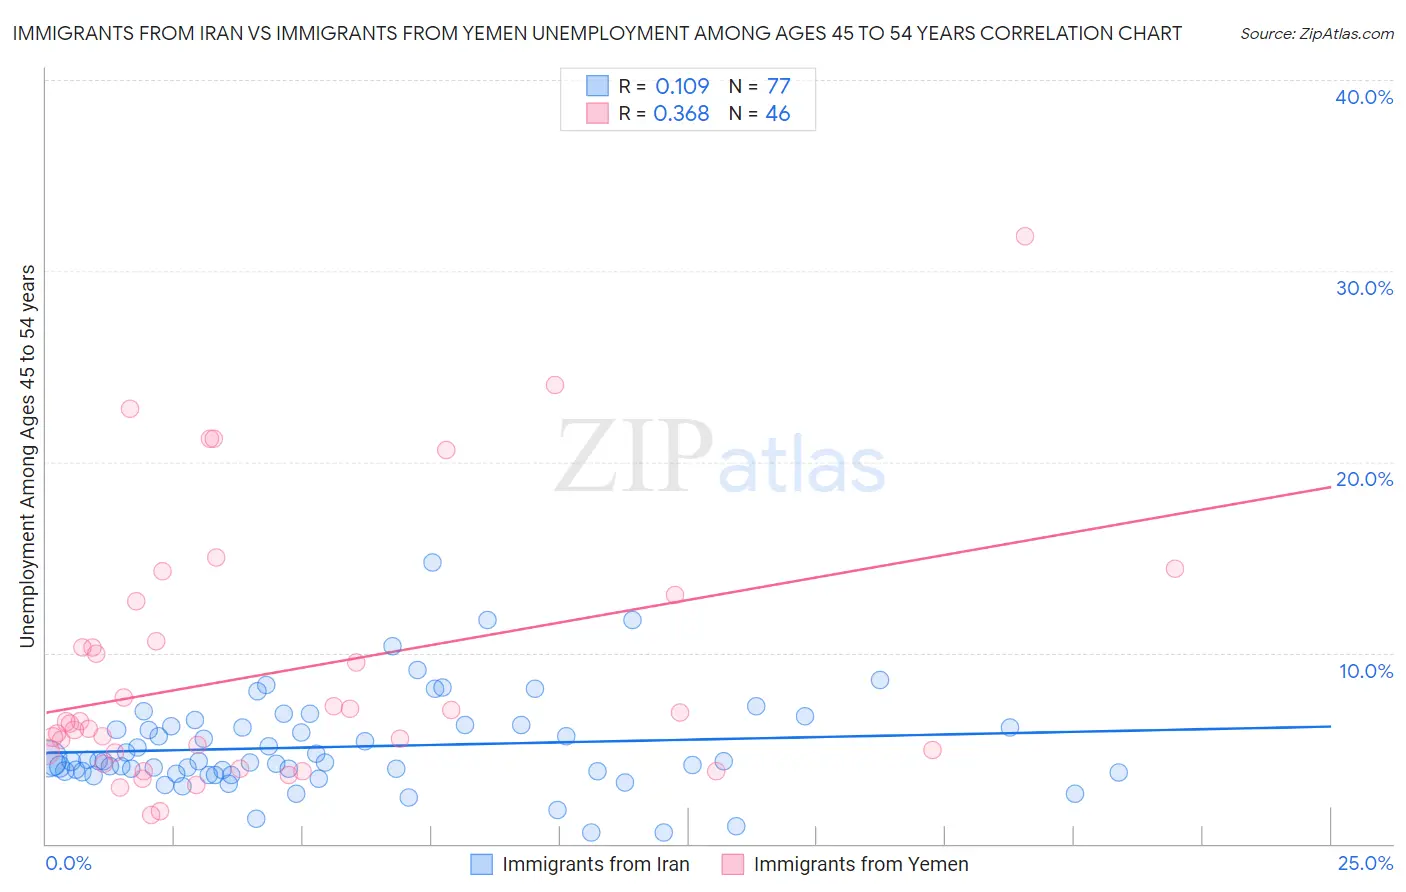
Immigrants from Iran vs Immigrants from Yemen Unemployment Among Ages 45 to 54 years Correlation Chart
The statistical analysis conducted on geographies consisting of 276,106,625 people shows a poor positive correlation between the proportion of Immigrants from Iran and unemployment rate among population between the ages 45 and 54 in the United States with a correlation coefficient (R) of 0.109 and weighted average of 4.6%. Similarly, the statistical analysis conducted on geographies consisting of 82,096,042 people shows a mild positive correlation between the proportion of Immigrants from Yemen and unemployment rate among population between the ages 45 and 54 in the United States with a correlation coefficient (R) of 0.368 and weighted average of 6.5%, a difference of 41.5%.
Unemployment Among Ages 45 to 54 years Correlation Summary
| Measurement | Immigrants from Iran | Immigrants from Yemen |
| Minimum | 0.60% | 1.5% |
| Maximum | 14.7% | 31.8% |
| Range | 14.1% | 30.3% |
| Mean | 5.1% | 9.0% |
| Median | 4.3% | 6.3% |
| Interquartile 25% (IQ1) | 3.7% | 4.8% |
| Interquartile 75% (IQ3) | 6.2% | 10.6% |
| Interquartile Range (IQR) | 2.5% | 5.8% |
| Standard Deviation (Sample) | 2.5% | 6.7% |
| Standard Deviation (Population) | 2.5% | 6.7% |
Similar Demographics by Unemployment Among Ages 45 to 54 years
Demographics Similar to Immigrants from Iran by Unemployment Among Ages 45 to 54 years
In terms of unemployment among ages 45 to 54 years, the demographic groups most similar to Immigrants from Iran are Creek (4.6%, a difference of 0.040%), Immigrants from South America (4.6%, a difference of 0.070%), Panamanian (4.6%, a difference of 0.090%), Cherokee (4.6%, a difference of 0.11%), and Immigrants from Panama (4.6%, a difference of 0.13%).
| Demographics | Rating | Rank | Unemployment Among Ages 45 to 54 years |
| Immigrants | Greece | 16.2 /100 | #205 | Poor 4.6% |
| Immigrants | Switzerland | 14.0 /100 | #206 | Poor 4.6% |
| Arabs | 13.7 /100 | #207 | Poor 4.6% |
| Immigrants | Africa | 13.6 /100 | #208 | Poor 4.6% |
| Immigrants | Nigeria | 13.3 /100 | #209 | Poor 4.6% |
| Immigrants | South America | 12.2 /100 | #210 | Poor 4.6% |
| Creek | 11.9 /100 | #211 | Poor 4.6% |
| Immigrants | Iran | 11.5 /100 | #212 | Poor 4.6% |
| Panamanians | 10.7 /100 | #213 | Poor 4.6% |
| Cherokee | 10.6 /100 | #214 | Poor 4.6% |
| Immigrants | Panama | 10.4 /100 | #215 | Poor 4.6% |
| Lumbee | 9.2 /100 | #216 | Tragic 4.6% |
| Immigrants | Cambodia | 7.4 /100 | #217 | Tragic 4.7% |
| Immigrants | Uganda | 7.1 /100 | #218 | Tragic 4.7% |
| Nigerians | 7.0 /100 | #219 | Tragic 4.7% |
Demographics Similar to Immigrants from Yemen by Unemployment Among Ages 45 to 54 years
In terms of unemployment among ages 45 to 54 years, the demographic groups most similar to Immigrants from Yemen are Sioux (6.6%, a difference of 1.1%), Navajo (6.7%, a difference of 1.5%), Pima (6.4%, a difference of 1.7%), Puerto Rican (6.8%, a difference of 3.8%), and Tohono O'odham (6.3%, a difference of 4.5%).
| Demographics | Rating | Rank | Unemployment Among Ages 45 to 54 years |
| Ute | 0.0 /100 | #326 | Tragic 6.2% |
| Dominicans | 0.0 /100 | #327 | Tragic 6.2% |
| Pueblo | 0.0 /100 | #328 | Tragic 6.2% |
| Alaska Natives | 0.0 /100 | #329 | Tragic 6.3% |
| Immigrants | Dominican Republic | 0.0 /100 | #330 | Tragic 6.3% |
| Tohono O'odham | 0.0 /100 | #331 | Tragic 6.3% |
| Pima | 0.0 /100 | #332 | Tragic 6.4% |
| Immigrants | Yemen | 0.0 /100 | #333 | Tragic 6.5% |
| Sioux | 0.0 /100 | #334 | Tragic 6.6% |
| Navajo | 0.0 /100 | #335 | Tragic 6.7% |
| Puerto Ricans | 0.0 /100 | #336 | Tragic 6.8% |
| Apache | 0.0 /100 | #337 | Tragic 7.0% |
| Colville | 0.0 /100 | #338 | Tragic 7.4% |
| Arapaho | 0.0 /100 | #339 | Tragic 7.5% |
| Hopi | 0.0 /100 | #340 | Tragic 7.5% |