Immigrants from Iran vs Immigrants from Nicaragua Cognitive Disability
COMPARE
Immigrants from Iran
Immigrants from Nicaragua
Cognitive Disability
Cognitive Disability Comparison
Immigrants from Iran
Immigrants from Nicaragua
16.5%
COGNITIVE DISABILITY
99.8/ 100
METRIC RATING
54th/ 347
METRIC RANK
16.8%
COGNITIVE DISABILITY
97.8/ 100
METRIC RATING
107th/ 347
METRIC RANK
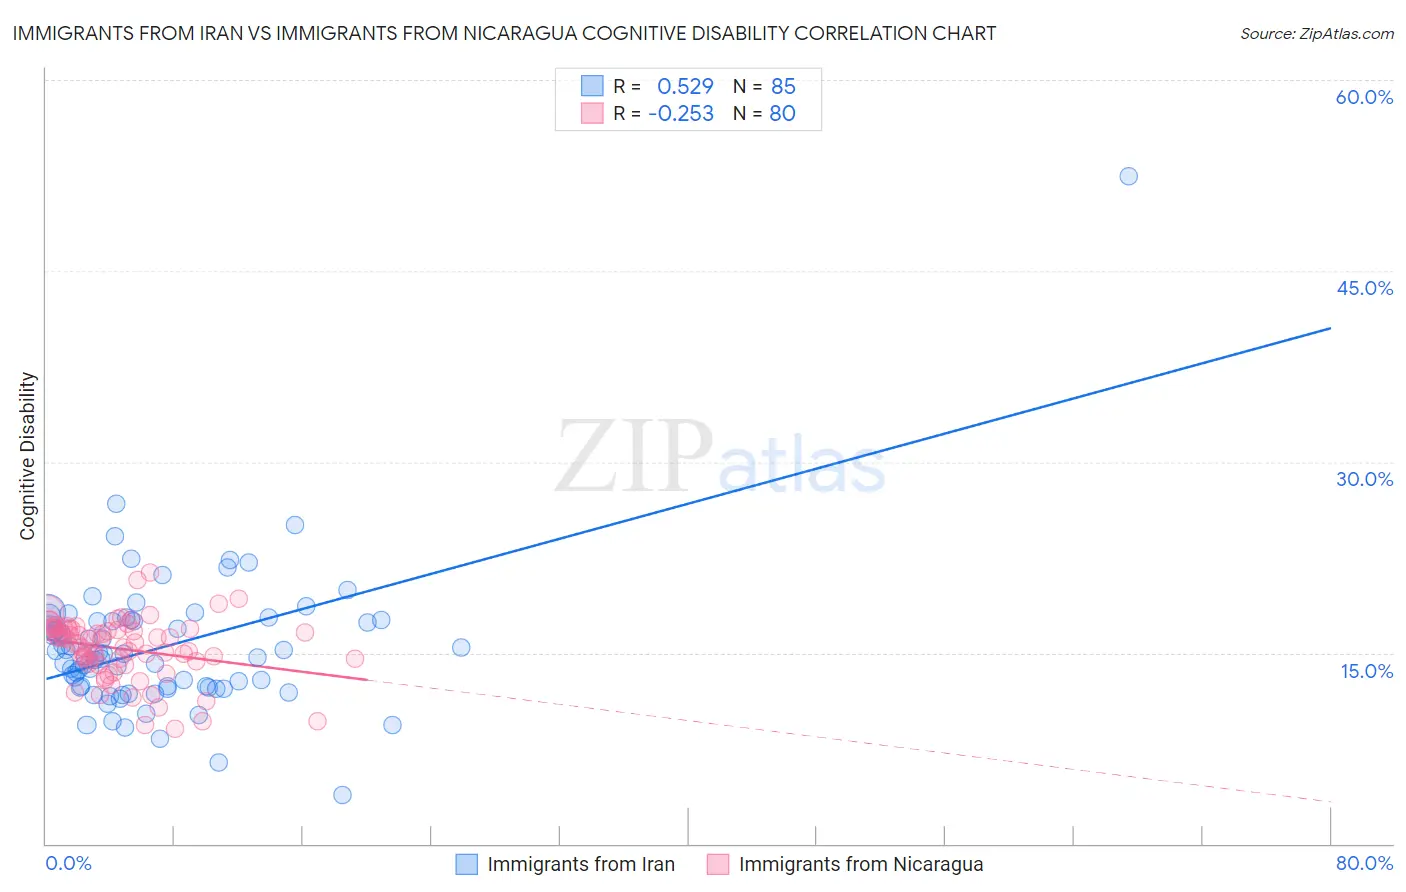
Immigrants from Iran vs Immigrants from Nicaragua Cognitive Disability Correlation Chart
The statistical analysis conducted on geographies consisting of 279,837,445 people shows a substantial positive correlation between the proportion of Immigrants from Iran and percentage of population with cognitive disability in the United States with a correlation coefficient (R) of 0.529 and weighted average of 16.5%. Similarly, the statistical analysis conducted on geographies consisting of 236,326,974 people shows a weak negative correlation between the proportion of Immigrants from Nicaragua and percentage of population with cognitive disability in the United States with a correlation coefficient (R) of -0.253 and weighted average of 16.8%, a difference of 1.7%.
Cognitive Disability Correlation Summary
| Measurement | Immigrants from Iran | Immigrants from Nicaragua |
| Minimum | 3.9% | 9.1% |
| Maximum | 52.5% | 21.3% |
| Range | 48.6% | 12.2% |
| Mean | 15.5% | 15.3% |
| Median | 14.9% | 15.8% |
| Interquartile 25% (IQ1) | 12.3% | 14.2% |
| Interquartile 75% (IQ3) | 17.5% | 16.9% |
| Interquartile Range (IQR) | 5.3% | 2.7% |
| Standard Deviation (Sample) | 5.7% | 2.4% |
| Standard Deviation (Population) | 5.7% | 2.4% |
Similar Demographics by Cognitive Disability
Demographics Similar to Immigrants from Iran by Cognitive Disability
In terms of cognitive disability, the demographic groups most similar to Immigrants from Iran are Swedish (16.5%, a difference of 0.040%), Immigrants from Venezuela (16.5%, a difference of 0.090%), Soviet Union (16.5%, a difference of 0.10%), Immigrants from Korea (16.5%, a difference of 0.14%), and Austrian (16.6%, a difference of 0.18%).
| Demographics | Rating | Rank | Cognitive Disability |
| Immigrants | Italy | 99.8 /100 | #47 | Exceptional 16.5% |
| Immigrants | North America | 99.8 /100 | #48 | Exceptional 16.5% |
| Iranians | 99.8 /100 | #49 | Exceptional 16.5% |
| Norwegians | 99.8 /100 | #50 | Exceptional 16.5% |
| Immigrants | Korea | 99.8 /100 | #51 | Exceptional 16.5% |
| Soviet Union | 99.8 /100 | #52 | Exceptional 16.5% |
| Swedes | 99.8 /100 | #53 | Exceptional 16.5% |
| Immigrants | Iran | 99.8 /100 | #54 | Exceptional 16.5% |
| Immigrants | Venezuela | 99.7 /100 | #55 | Exceptional 16.5% |
| Austrians | 99.7 /100 | #56 | Exceptional 16.6% |
| Bhutanese | 99.7 /100 | #57 | Exceptional 16.6% |
| Pennsylvania Germans | 99.7 /100 | #58 | Exceptional 16.6% |
| Immigrants | Peru | 99.7 /100 | #59 | Exceptional 16.6% |
| Romanians | 99.7 /100 | #60 | Exceptional 16.6% |
| Immigrants | England | 99.6 /100 | #61 | Exceptional 16.6% |
Demographics Similar to Immigrants from Nicaragua by Cognitive Disability
In terms of cognitive disability, the demographic groups most similar to Immigrants from Nicaragua are Northern European (16.8%, a difference of 0.020%), Immigrants from Eastern Asia (16.8%, a difference of 0.060%), Paraguayan (16.8%, a difference of 0.070%), Palestinian (16.8%, a difference of 0.070%), and Canadian (16.8%, a difference of 0.090%).
| Demographics | Rating | Rank | Cognitive Disability |
| Immigrants | Russia | 98.2 /100 | #100 | Exceptional 16.8% |
| Immigrants | Asia | 98.1 /100 | #101 | Exceptional 16.8% |
| Irish | 98.1 /100 | #102 | Exceptional 16.8% |
| Paraguayans | 98.0 /100 | #103 | Exceptional 16.8% |
| Palestinians | 98.0 /100 | #104 | Exceptional 16.8% |
| Immigrants | Eastern Asia | 97.9 /100 | #105 | Exceptional 16.8% |
| Northern Europeans | 97.8 /100 | #106 | Exceptional 16.8% |
| Immigrants | Nicaragua | 97.8 /100 | #107 | Exceptional 16.8% |
| Canadians | 97.5 /100 | #108 | Exceptional 16.8% |
| Albanians | 97.3 /100 | #109 | Exceptional 16.8% |
| Arapaho | 97.3 /100 | #110 | Exceptional 16.8% |
| Uruguayans | 97.2 /100 | #111 | Exceptional 16.8% |
| Indians (Asian) | 97.2 /100 | #112 | Exceptional 16.8% |
| Immigrants | Sri Lanka | 97.1 /100 | #113 | Exceptional 16.8% |
| Koreans | 97.1 /100 | #114 | Exceptional 16.8% |