Immigrants from Iran vs Thai Cognitive Disability
COMPARE
Immigrants from Iran
Thai
Cognitive Disability
Cognitive Disability Comparison
Immigrants from Iran
Thais
16.5%
COGNITIVE DISABILITY
99.8/ 100
METRIC RATING
54th/ 347
METRIC RANK
16.1%
COGNITIVE DISABILITY
100.0/ 100
METRIC RATING
6th/ 347
METRIC RANK
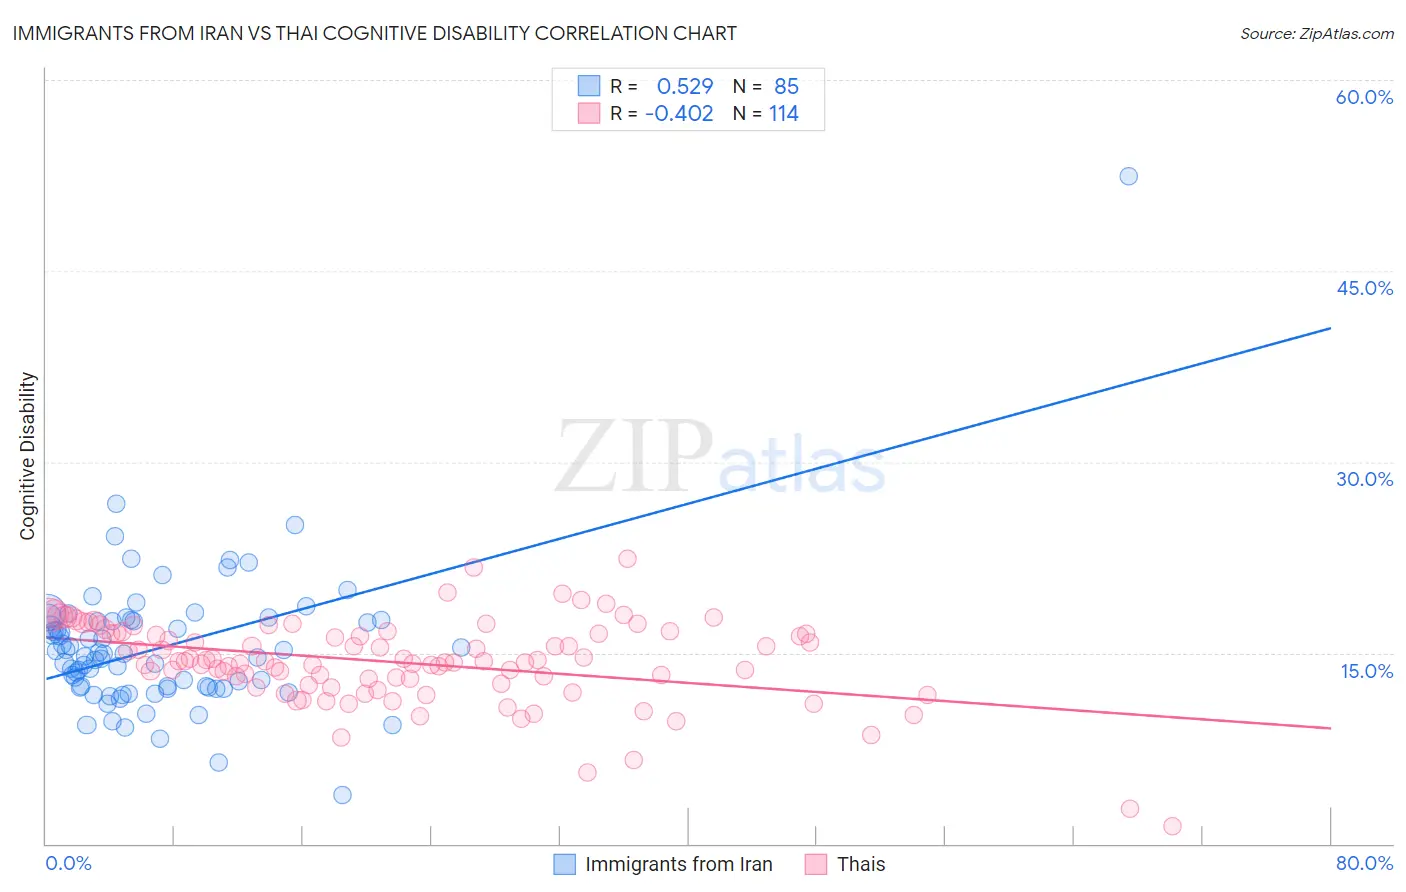
Immigrants from Iran vs Thai Cognitive Disability Correlation Chart
The statistical analysis conducted on geographies consisting of 279,837,445 people shows a substantial positive correlation between the proportion of Immigrants from Iran and percentage of population with cognitive disability in the United States with a correlation coefficient (R) of 0.529 and weighted average of 16.5%. Similarly, the statistical analysis conducted on geographies consisting of 475,822,165 people shows a moderate negative correlation between the proportion of Thais and percentage of population with cognitive disability in the United States with a correlation coefficient (R) of -0.402 and weighted average of 16.1%, a difference of 2.6%.
Cognitive Disability Correlation Summary
| Measurement | Immigrants from Iran | Thai |
| Minimum | 3.9% | 1.4% |
| Maximum | 52.5% | 22.4% |
| Range | 48.6% | 21.1% |
| Mean | 15.5% | 14.3% |
| Median | 14.9% | 14.3% |
| Interquartile 25% (IQ1) | 12.3% | 12.6% |
| Interquartile 75% (IQ3) | 17.5% | 16.5% |
| Interquartile Range (IQR) | 5.3% | 3.9% |
| Standard Deviation (Sample) | 5.7% | 3.3% |
| Standard Deviation (Population) | 5.7% | 3.3% |
Similar Demographics by Cognitive Disability
Demographics Similar to Immigrants from Iran by Cognitive Disability
In terms of cognitive disability, the demographic groups most similar to Immigrants from Iran are Swedish (16.5%, a difference of 0.040%), Immigrants from Venezuela (16.5%, a difference of 0.090%), Soviet Union (16.5%, a difference of 0.10%), Immigrants from Korea (16.5%, a difference of 0.14%), and Austrian (16.6%, a difference of 0.18%).
| Demographics | Rating | Rank | Cognitive Disability |
| Immigrants | Italy | 99.8 /100 | #47 | Exceptional 16.5% |
| Immigrants | North America | 99.8 /100 | #48 | Exceptional 16.5% |
| Iranians | 99.8 /100 | #49 | Exceptional 16.5% |
| Norwegians | 99.8 /100 | #50 | Exceptional 16.5% |
| Immigrants | Korea | 99.8 /100 | #51 | Exceptional 16.5% |
| Soviet Union | 99.8 /100 | #52 | Exceptional 16.5% |
| Swedes | 99.8 /100 | #53 | Exceptional 16.5% |
| Immigrants | Iran | 99.8 /100 | #54 | Exceptional 16.5% |
| Immigrants | Venezuela | 99.7 /100 | #55 | Exceptional 16.5% |
| Austrians | 99.7 /100 | #56 | Exceptional 16.6% |
| Bhutanese | 99.7 /100 | #57 | Exceptional 16.6% |
| Pennsylvania Germans | 99.7 /100 | #58 | Exceptional 16.6% |
| Immigrants | Peru | 99.7 /100 | #59 | Exceptional 16.6% |
| Romanians | 99.7 /100 | #60 | Exceptional 16.6% |
| Immigrants | England | 99.6 /100 | #61 | Exceptional 16.6% |
Demographics Similar to Thais by Cognitive Disability
In terms of cognitive disability, the demographic groups most similar to Thais are Immigrants from Ireland (16.1%, a difference of 0.11%), Immigrants from Poland (16.1%, a difference of 0.13%), Assyrian/Chaldean/Syriac (16.2%, a difference of 0.45%), Immigrants from Scotland (16.2%, a difference of 0.50%), and Immigrants from Czechoslovakia (16.2%, a difference of 0.58%).
| Demographics | Rating | Rank | Cognitive Disability |
| Immigrants | Taiwan | 100.0 /100 | #1 | Exceptional 15.7% |
| Immigrants | India | 100.0 /100 | #2 | Exceptional 15.9% |
| Chinese | 100.0 /100 | #3 | Exceptional 15.9% |
| Immigrants | Lithuania | 100.0 /100 | #4 | Exceptional 16.0% |
| Immigrants | Hong Kong | 100.0 /100 | #5 | Exceptional 16.0% |
| Thais | 100.0 /100 | #6 | Exceptional 16.1% |
| Immigrants | Ireland | 100.0 /100 | #7 | Exceptional 16.1% |
| Immigrants | Poland | 100.0 /100 | #8 | Exceptional 16.1% |
| Assyrians/Chaldeans/Syriacs | 100.0 /100 | #9 | Exceptional 16.2% |
| Immigrants | Scotland | 100.0 /100 | #10 | Exceptional 16.2% |
| Immigrants | Czechoslovakia | 100.0 /100 | #11 | Exceptional 16.2% |
| Maltese | 100.0 /100 | #12 | Exceptional 16.2% |
| Lithuanians | 100.0 /100 | #13 | Exceptional 16.3% |
| Immigrants | Austria | 100.0 /100 | #14 | Exceptional 16.3% |
| Immigrants | Greece | 100.0 /100 | #15 | Exceptional 16.3% |