Immigrants from Iran vs Belizean Hearing Disability
COMPARE
Immigrants from Iran
Belizean
Hearing Disability
Hearing Disability Comparison
Immigrants from Iran
Belizeans
2.8%
HEARING DISABILITY
96.8/ 100
METRIC RATING
86th/ 347
METRIC RANK
2.8%
HEARING DISABILITY
96.6/ 100
METRIC RATING
89th/ 347
METRIC RANK
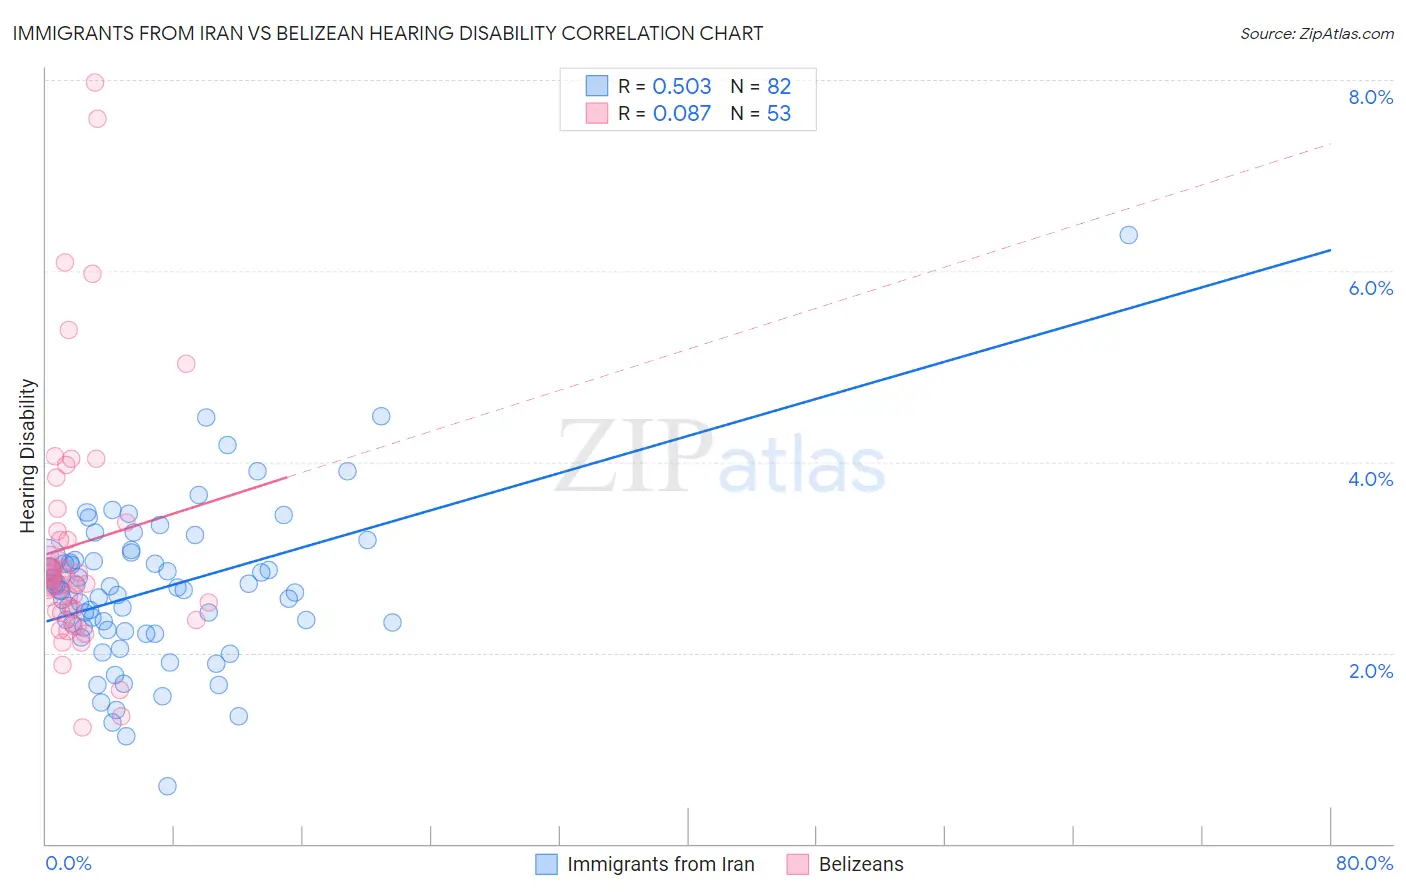
Immigrants from Iran vs Belizean Hearing Disability Correlation Chart
The statistical analysis conducted on geographies consisting of 279,867,753 people shows a substantial positive correlation between the proportion of Immigrants from Iran and percentage of population with hearing disability in the United States with a correlation coefficient (R) of 0.503 and weighted average of 2.8%. Similarly, the statistical analysis conducted on geographies consisting of 144,164,730 people shows a slight positive correlation between the proportion of Belizeans and percentage of population with hearing disability in the United States with a correlation coefficient (R) of 0.087 and weighted average of 2.8%, a difference of 0.17%.
Hearing Disability Correlation Summary
| Measurement | Immigrants from Iran | Belizean |
| Minimum | 0.60% | 1.2% |
| Maximum | 6.4% | 8.0% |
| Range | 5.8% | 6.8% |
| Mean | 2.7% | 3.1% |
| Median | 2.7% | 2.8% |
| Interquartile 25% (IQ1) | 2.2% | 2.4% |
| Interquartile 75% (IQ3) | 3.0% | 3.3% |
| Interquartile Range (IQR) | 0.74% | 0.89% |
| Standard Deviation (Sample) | 0.83% | 1.4% |
| Standard Deviation (Population) | 0.82% | 1.3% |
Demographics Similar to Immigrants from Iran and Belizeans by Hearing Disability
In terms of hearing disability, the demographic groups most similar to Immigrants from Iran are Immigrants from Northern Africa (2.8%, a difference of 0.020%), Immigrants from Argentina (2.8%, a difference of 0.10%), Somali (2.8%, a difference of 0.11%), Immigrants from Turkey (2.8%, a difference of 0.14%), and Immigrants from Morocco (2.8%, a difference of 0.20%). Similarly, the demographic groups most similar to Belizeans are Immigrants from Turkey (2.8%, a difference of 0.030%), Immigrants from Morocco (2.8%, a difference of 0.030%), Somali (2.8%, a difference of 0.070%), Immigrants from Middle Africa (2.8%, a difference of 0.11%), and Iranian (2.8%, a difference of 0.14%).
| Demographics | Rating | Rank | Hearing Disability |
| Immigrants | Malaysia | 97.5 /100 | #77 | Exceptional 2.7% |
| Mongolians | 97.4 /100 | #78 | Exceptional 2.7% |
| Colombians | 97.4 /100 | #79 | Exceptional 2.7% |
| Immigrants | Asia | 97.2 /100 | #80 | Exceptional 2.7% |
| Immigrants | Uruguay | 97.2 /100 | #81 | Exceptional 2.7% |
| Immigrants | Armenia | 97.2 /100 | #82 | Exceptional 2.7% |
| Immigrants | Cuba | 97.2 /100 | #83 | Exceptional 2.7% |
| Immigrants | Argentina | 97.0 /100 | #84 | Exceptional 2.8% |
| Immigrants | Northern Africa | 96.9 /100 | #85 | Exceptional 2.8% |
| Immigrants | Iran | 96.8 /100 | #86 | Exceptional 2.8% |
| Somalis | 96.7 /100 | #87 | Exceptional 2.8% |
| Immigrants | Turkey | 96.7 /100 | #88 | Exceptional 2.8% |
| Belizeans | 96.6 /100 | #89 | Exceptional 2.8% |
| Immigrants | Morocco | 96.6 /100 | #90 | Exceptional 2.8% |
| Immigrants | Middle Africa | 96.5 /100 | #91 | Exceptional 2.8% |
| Iranians | 96.4 /100 | #92 | Exceptional 2.8% |
| Immigrants | Kuwait | 96.3 /100 | #93 | Exceptional 2.8% |
| Uruguayans | 95.9 /100 | #94 | Exceptional 2.8% |
| Israelis | 95.9 /100 | #95 | Exceptional 2.8% |
| Immigrants | Somalia | 95.5 /100 | #96 | Exceptional 2.8% |
| Immigrants | Afghanistan | 95.3 /100 | #97 | Exceptional 2.8% |