Immigrants from Indonesia vs Immigrants from Iraq Disability
COMPARE
Immigrants from Indonesia
Immigrants from Iraq
Disability
Disability Comparison
Immigrants from Indonesia
Immigrants from Iraq
10.7%
DISABILITY
100.0/ 100
METRIC RATING
35th/ 347
METRIC RANK
12.0%
DISABILITY
7.1/ 100
METRIC RATING
213th/ 347
METRIC RANK
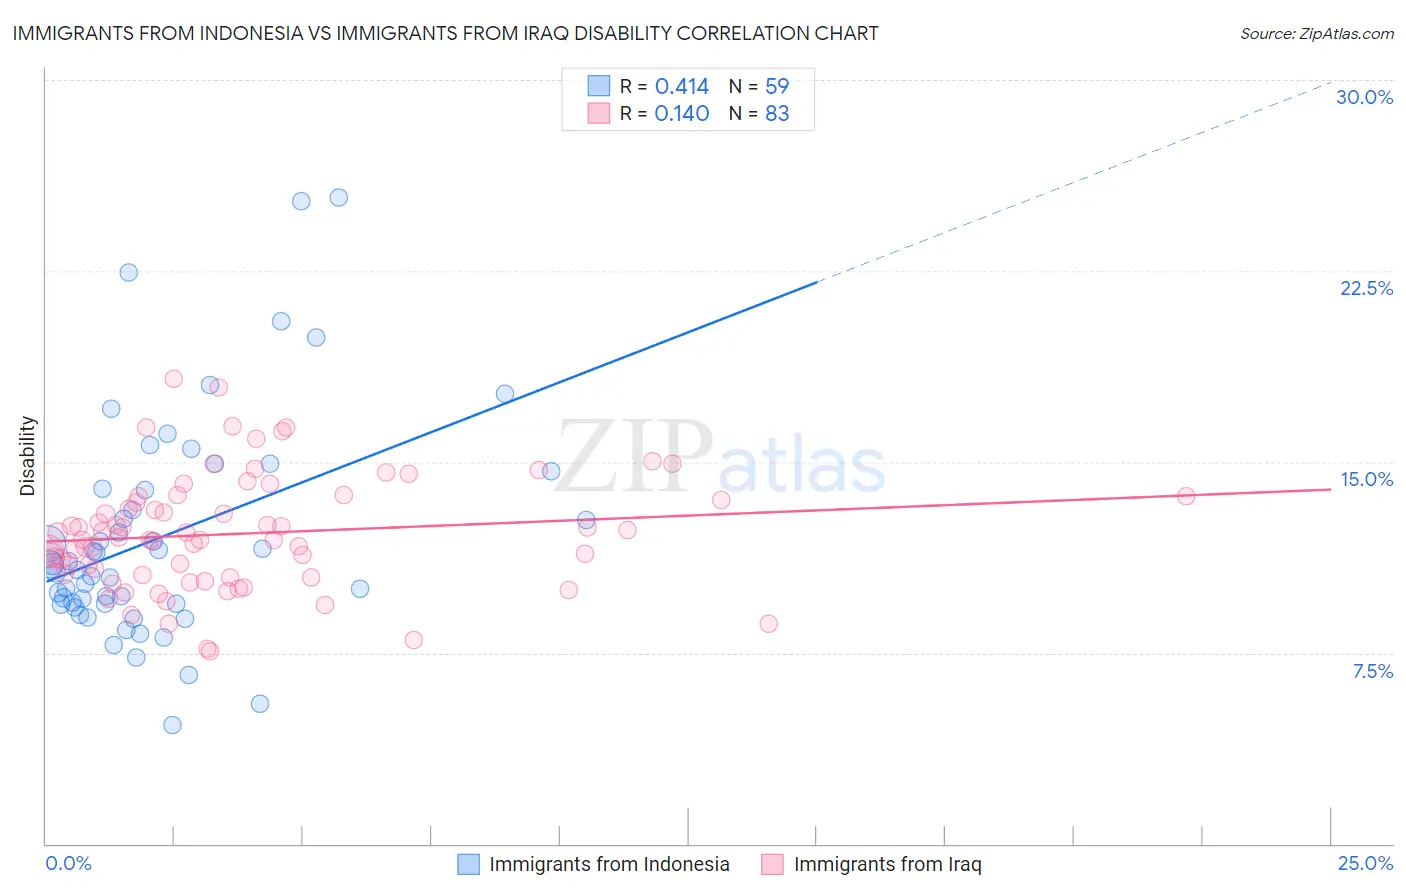
Immigrants from Indonesia vs Immigrants from Iraq Disability Correlation Chart
The statistical analysis conducted on geographies consisting of 215,790,379 people shows a moderate positive correlation between the proportion of Immigrants from Indonesia and percentage of population with a disability in the United States with a correlation coefficient (R) of 0.414 and weighted average of 10.7%. Similarly, the statistical analysis conducted on geographies consisting of 194,773,815 people shows a poor positive correlation between the proportion of Immigrants from Iraq and percentage of population with a disability in the United States with a correlation coefficient (R) of 0.140 and weighted average of 12.0%, a difference of 12.4%.
Disability Correlation Summary
| Measurement | Immigrants from Indonesia | Immigrants from Iraq |
| Minimum | 4.7% | 7.6% |
| Maximum | 25.4% | 18.2% |
| Range | 20.7% | 10.7% |
| Mean | 12.1% | 12.2% |
| Median | 11.0% | 11.9% |
| Interquartile 25% (IQ1) | 9.4% | 10.6% |
| Interquartile 75% (IQ3) | 14.0% | 13.7% |
| Interquartile Range (IQR) | 4.5% | 3.1% |
| Standard Deviation (Sample) | 4.3% | 2.2% |
| Standard Deviation (Population) | 4.3% | 2.2% |
Similar Demographics by Disability
Demographics Similar to Immigrants from Indonesia by Disability
In terms of disability, the demographic groups most similar to Immigrants from Indonesia are Immigrants from Ethiopia (10.7%, a difference of 0.010%), Ethiopian (10.7%, a difference of 0.060%), Turkish (10.7%, a difference of 0.070%), Immigrants from Kuwait (10.7%, a difference of 0.23%), and Paraguayan (10.6%, a difference of 0.48%).
| Demographics | Rating | Rank | Disability |
| Egyptians | 100.0 /100 | #28 | Exceptional 10.6% |
| Immigrants | Argentina | 100.0 /100 | #29 | Exceptional 10.6% |
| Immigrants | Turkey | 100.0 /100 | #30 | Exceptional 10.6% |
| Immigrants | Egypt | 100.0 /100 | #31 | Exceptional 10.6% |
| Paraguayans | 100.0 /100 | #32 | Exceptional 10.6% |
| Immigrants | Kuwait | 100.0 /100 | #33 | Exceptional 10.7% |
| Immigrants | Ethiopia | 100.0 /100 | #34 | Exceptional 10.7% |
| Immigrants | Indonesia | 100.0 /100 | #35 | Exceptional 10.7% |
| Ethiopians | 100.0 /100 | #36 | Exceptional 10.7% |
| Turks | 100.0 /100 | #37 | Exceptional 10.7% |
| Afghans | 99.9 /100 | #38 | Exceptional 10.8% |
| Cambodians | 99.9 /100 | #39 | Exceptional 10.8% |
| Mongolians | 99.9 /100 | #40 | Exceptional 10.8% |
| Immigrants | Australia | 99.9 /100 | #41 | Exceptional 10.8% |
| Immigrants | Nepal | 99.9 /100 | #42 | Exceptional 10.8% |
Demographics Similar to Immigrants from Iraq by Disability
In terms of disability, the demographic groups most similar to Immigrants from Iraq are Austrian (12.0%, a difference of 0.010%), Immigrants from Cambodia (12.0%, a difference of 0.030%), Immigrants from Somalia (12.0%, a difference of 0.050%), Czech (12.0%, a difference of 0.11%), and Immigrants from Canada (12.1%, a difference of 0.18%).
| Demographics | Rating | Rank | Disability |
| Immigrants | Senegal | 9.4 /100 | #206 | Tragic 12.0% |
| Immigrants | Thailand | 9.3 /100 | #207 | Tragic 12.0% |
| Immigrants | Caribbean | 9.1 /100 | #208 | Tragic 12.0% |
| Danes | 8.7 /100 | #209 | Tragic 12.0% |
| Czechs | 7.9 /100 | #210 | Tragic 12.0% |
| Immigrants | Cambodia | 7.3 /100 | #211 | Tragic 12.0% |
| Austrians | 7.2 /100 | #212 | Tragic 12.0% |
| Immigrants | Iraq | 7.1 /100 | #213 | Tragic 12.0% |
| Immigrants | Somalia | 6.8 /100 | #214 | Tragic 12.0% |
| Immigrants | Canada | 6.1 /100 | #215 | Tragic 12.1% |
| Panamanians | 5.4 /100 | #216 | Tragic 12.1% |
| Immigrants | North America | 5.3 /100 | #217 | Tragic 12.1% |
| Immigrants | Jamaica | 5.0 /100 | #218 | Tragic 12.1% |
| Croatians | 4.9 /100 | #219 | Tragic 12.1% |
| Immigrants | Bahamas | 4.7 /100 | #220 | Tragic 12.1% |