Immigrants from Indonesia vs Immigrants from Eastern Africa Disability
COMPARE
Immigrants from Indonesia
Immigrants from Eastern Africa
Disability
Disability Comparison
Immigrants from Indonesia
Immigrants from Eastern Africa
10.7%
DISABILITY
100.0/ 100
METRIC RATING
35th/ 347
METRIC RANK
11.3%
DISABILITY
96.7/ 100
METRIC RATING
102nd/ 347
METRIC RANK
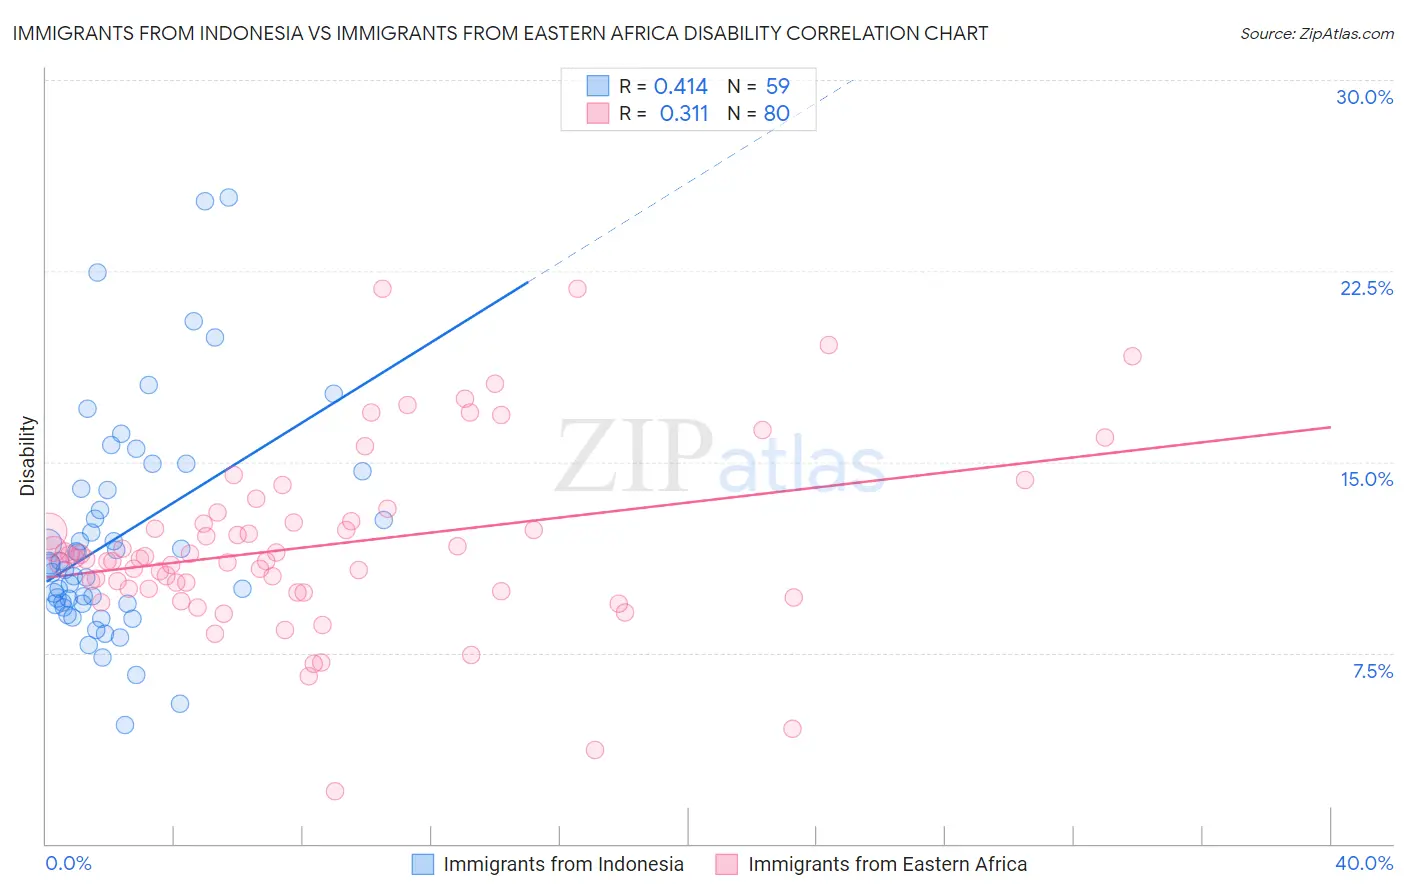
Immigrants from Indonesia vs Immigrants from Eastern Africa Disability Correlation Chart
The statistical analysis conducted on geographies consisting of 215,790,379 people shows a moderate positive correlation between the proportion of Immigrants from Indonesia and percentage of population with a disability in the United States with a correlation coefficient (R) of 0.414 and weighted average of 10.7%. Similarly, the statistical analysis conducted on geographies consisting of 355,125,072 people shows a mild positive correlation between the proportion of Immigrants from Eastern Africa and percentage of population with a disability in the United States with a correlation coefficient (R) of 0.311 and weighted average of 11.3%, a difference of 5.3%.
Disability Correlation Summary
| Measurement | Immigrants from Indonesia | Immigrants from Eastern Africa |
| Minimum | 4.7% | 2.1% |
| Maximum | 25.4% | 21.8% |
| Range | 20.7% | 19.7% |
| Mean | 12.1% | 11.7% |
| Median | 11.0% | 11.2% |
| Interquartile 25% (IQ1) | 9.4% | 10.0% |
| Interquartile 75% (IQ3) | 14.0% | 12.7% |
| Interquartile Range (IQR) | 4.5% | 2.7% |
| Standard Deviation (Sample) | 4.3% | 3.5% |
| Standard Deviation (Population) | 4.3% | 3.5% |
Similar Demographics by Disability
Demographics Similar to Immigrants from Indonesia by Disability
In terms of disability, the demographic groups most similar to Immigrants from Indonesia are Immigrants from Ethiopia (10.7%, a difference of 0.010%), Ethiopian (10.7%, a difference of 0.060%), Turkish (10.7%, a difference of 0.070%), Immigrants from Kuwait (10.7%, a difference of 0.23%), and Paraguayan (10.6%, a difference of 0.48%).
| Demographics | Rating | Rank | Disability |
| Egyptians | 100.0 /100 | #28 | Exceptional 10.6% |
| Immigrants | Argentina | 100.0 /100 | #29 | Exceptional 10.6% |
| Immigrants | Turkey | 100.0 /100 | #30 | Exceptional 10.6% |
| Immigrants | Egypt | 100.0 /100 | #31 | Exceptional 10.6% |
| Paraguayans | 100.0 /100 | #32 | Exceptional 10.6% |
| Immigrants | Kuwait | 100.0 /100 | #33 | Exceptional 10.7% |
| Immigrants | Ethiopia | 100.0 /100 | #34 | Exceptional 10.7% |
| Immigrants | Indonesia | 100.0 /100 | #35 | Exceptional 10.7% |
| Ethiopians | 100.0 /100 | #36 | Exceptional 10.7% |
| Turks | 100.0 /100 | #37 | Exceptional 10.7% |
| Afghans | 99.9 /100 | #38 | Exceptional 10.8% |
| Cambodians | 99.9 /100 | #39 | Exceptional 10.8% |
| Mongolians | 99.9 /100 | #40 | Exceptional 10.8% |
| Immigrants | Australia | 99.9 /100 | #41 | Exceptional 10.8% |
| Immigrants | Nepal | 99.9 /100 | #42 | Exceptional 10.8% |
Demographics Similar to Immigrants from Eastern Africa by Disability
In terms of disability, the demographic groups most similar to Immigrants from Eastern Africa are Immigrants from Nicaragua (11.3%, a difference of 0.060%), Immigrants from Uruguay (11.3%, a difference of 0.070%), Immigrants (11.3%, a difference of 0.080%), Immigrants from Kazakhstan (11.3%, a difference of 0.090%), and Immigrants from Greece (11.3%, a difference of 0.11%).
| Demographics | Rating | Rank | Disability |
| Eastern Europeans | 97.8 /100 | #95 | Exceptional 11.2% |
| Immigrants | Zimbabwe | 97.7 /100 | #96 | Exceptional 11.2% |
| Bhutanese | 97.4 /100 | #97 | Exceptional 11.2% |
| Uruguayans | 97.4 /100 | #98 | Exceptional 11.2% |
| Immigrants | Czechoslovakia | 97.4 /100 | #99 | Exceptional 11.2% |
| Immigrants | Greece | 96.9 /100 | #100 | Exceptional 11.3% |
| Immigrants | Nicaragua | 96.8 /100 | #101 | Exceptional 11.3% |
| Immigrants | Eastern Africa | 96.7 /100 | #102 | Exceptional 11.3% |
| Immigrants | Uruguay | 96.4 /100 | #103 | Exceptional 11.3% |
| Immigrants | Immigrants | 96.4 /100 | #104 | Exceptional 11.3% |
| Immigrants | Kazakhstan | 96.4 /100 | #105 | Exceptional 11.3% |
| Immigrants | Eastern Europe | 96.3 /100 | #106 | Exceptional 11.3% |
| Nicaraguans | 96.2 /100 | #107 | Exceptional 11.3% |
| Immigrants | Nigeria | 96.0 /100 | #108 | Exceptional 11.3% |
| Immigrants | Uganda | 95.7 /100 | #109 | Exceptional 11.3% |