Immigrants from India vs Immigrants from Albania Male Disability
COMPARE
Immigrants from India
Immigrants from Albania
Male Disability
Male Disability Comparison
Immigrants from India
Immigrants from Albania
9.0%
MALE DISABILITY
100.0/ 100
METRIC RATING
1st/ 347
METRIC RANK
11.0%
MALE DISABILITY
74.4/ 100
METRIC RATING
152nd/ 347
METRIC RANK
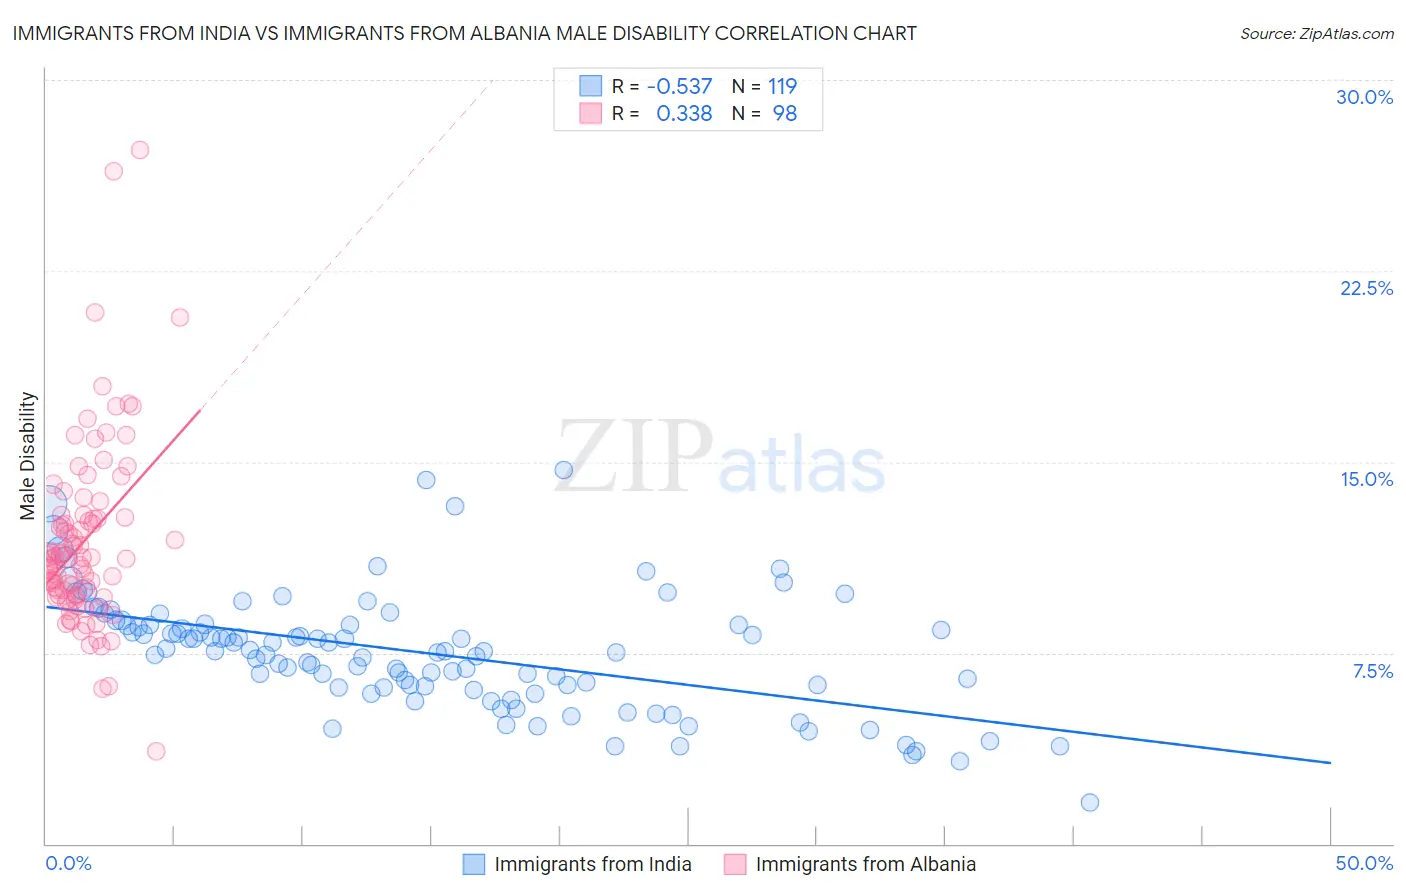
Immigrants from India vs Immigrants from Albania Male Disability Correlation Chart
The statistical analysis conducted on geographies consisting of 434,062,130 people shows a substantial negative correlation between the proportion of Immigrants from India and percentage of males with a disability in the United States with a correlation coefficient (R) of -0.537 and weighted average of 9.0%. Similarly, the statistical analysis conducted on geographies consisting of 119,394,562 people shows a mild positive correlation between the proportion of Immigrants from Albania and percentage of males with a disability in the United States with a correlation coefficient (R) of 0.338 and weighted average of 11.0%, a difference of 22.4%.
Male Disability Correlation Summary
| Measurement | Immigrants from India | Immigrants from Albania |
| Minimum | 1.6% | 3.6% |
| Maximum | 14.7% | 27.2% |
| Range | 13.0% | 23.6% |
| Mean | 7.5% | 11.9% |
| Median | 7.6% | 11.2% |
| Interquartile 25% (IQ1) | 6.2% | 9.8% |
| Interquartile 75% (IQ3) | 8.6% | 12.8% |
| Interquartile Range (IQR) | 2.5% | 3.0% |
| Standard Deviation (Sample) | 2.3% | 3.6% |
| Standard Deviation (Population) | 2.3% | 3.6% |
Similar Demographics by Male Disability
Demographics Similar to Immigrants from India by Male Disability
In terms of male disability, the demographic groups most similar to Immigrants from India are Immigrants from Taiwan (9.1%, a difference of 0.89%), Filipino (9.1%, a difference of 0.90%), Thai (9.2%, a difference of 2.2%), Immigrants from Hong Kong (9.4%, a difference of 4.4%), and Immigrants from South Central Asia (9.4%, a difference of 4.4%).
| Demographics | Rating | Rank | Male Disability |
| Immigrants | India | 100.0 /100 | #1 | Exceptional 9.0% |
| Immigrants | Taiwan | 100.0 /100 | #2 | Exceptional 9.1% |
| Filipinos | 100.0 /100 | #3 | Exceptional 9.1% |
| Thais | 100.0 /100 | #4 | Exceptional 9.2% |
| Immigrants | Hong Kong | 100.0 /100 | #5 | Exceptional 9.4% |
| Immigrants | South Central Asia | 100.0 /100 | #6 | Exceptional 9.4% |
| Immigrants | Bolivia | 100.0 /100 | #7 | Exceptional 9.5% |
| Immigrants | China | 100.0 /100 | #8 | Exceptional 9.5% |
| Immigrants | Singapore | 100.0 /100 | #9 | Exceptional 9.5% |
| Immigrants | Israel | 100.0 /100 | #10 | Exceptional 9.6% |
| Immigrants | Eastern Asia | 100.0 /100 | #11 | Exceptional 9.6% |
| Bolivians | 100.0 /100 | #12 | Exceptional 9.6% |
| Iranians | 100.0 /100 | #13 | Exceptional 9.7% |
| Immigrants | Iran | 100.0 /100 | #14 | Exceptional 9.7% |
| Indians (Asian) | 100.0 /100 | #15 | Exceptional 9.7% |
Demographics Similar to Immigrants from Albania by Male Disability
In terms of male disability, the demographic groups most similar to Immigrants from Albania are Cuban (11.0%, a difference of 0.030%), Immigrants from Guatemala (11.0%, a difference of 0.050%), Immigrants from Northern Europe (11.1%, a difference of 0.090%), Immigrants from Moldova (11.1%, a difference of 0.11%), and Immigrants from Denmark (11.0%, a difference of 0.15%).
| Demographics | Rating | Rank | Male Disability |
| Costa Ricans | 78.0 /100 | #145 | Good 11.0% |
| Koreans | 77.5 /100 | #146 | Good 11.0% |
| Immigrants | Croatia | 77.3 /100 | #147 | Good 11.0% |
| Sudanese | 77.1 /100 | #148 | Good 11.0% |
| Immigrants | Denmark | 76.4 /100 | #149 | Good 11.0% |
| Immigrants | Guatemala | 75.1 /100 | #150 | Good 11.0% |
| Cubans | 74.9 /100 | #151 | Good 11.0% |
| Immigrants | Albania | 74.4 /100 | #152 | Good 11.0% |
| Immigrants | Northern Europe | 73.2 /100 | #153 | Good 11.1% |
| Immigrants | Moldova | 72.8 /100 | #154 | Good 11.1% |
| Immigrants | Middle Africa | 70.9 /100 | #155 | Good 11.1% |
| Russians | 69.8 /100 | #156 | Good 11.1% |
| Immigrants | Western Africa | 69.2 /100 | #157 | Good 11.1% |
| Latvians | 68.1 /100 | #158 | Good 11.1% |
| Guatemalans | 67.2 /100 | #159 | Good 11.1% |