Immigrants from India vs Filipino Ambulatory Disability
COMPARE
Immigrants from India
Filipino
Ambulatory Disability
Ambulatory Disability Comparison
Immigrants from India
Filipinos
4.8%
AMBULATORY DISABILITY
100.0/ 100
METRIC RATING
1st/ 347
METRIC RANK
4.9%
AMBULATORY DISABILITY
100.0/ 100
METRIC RATING
2nd/ 347
METRIC RANK
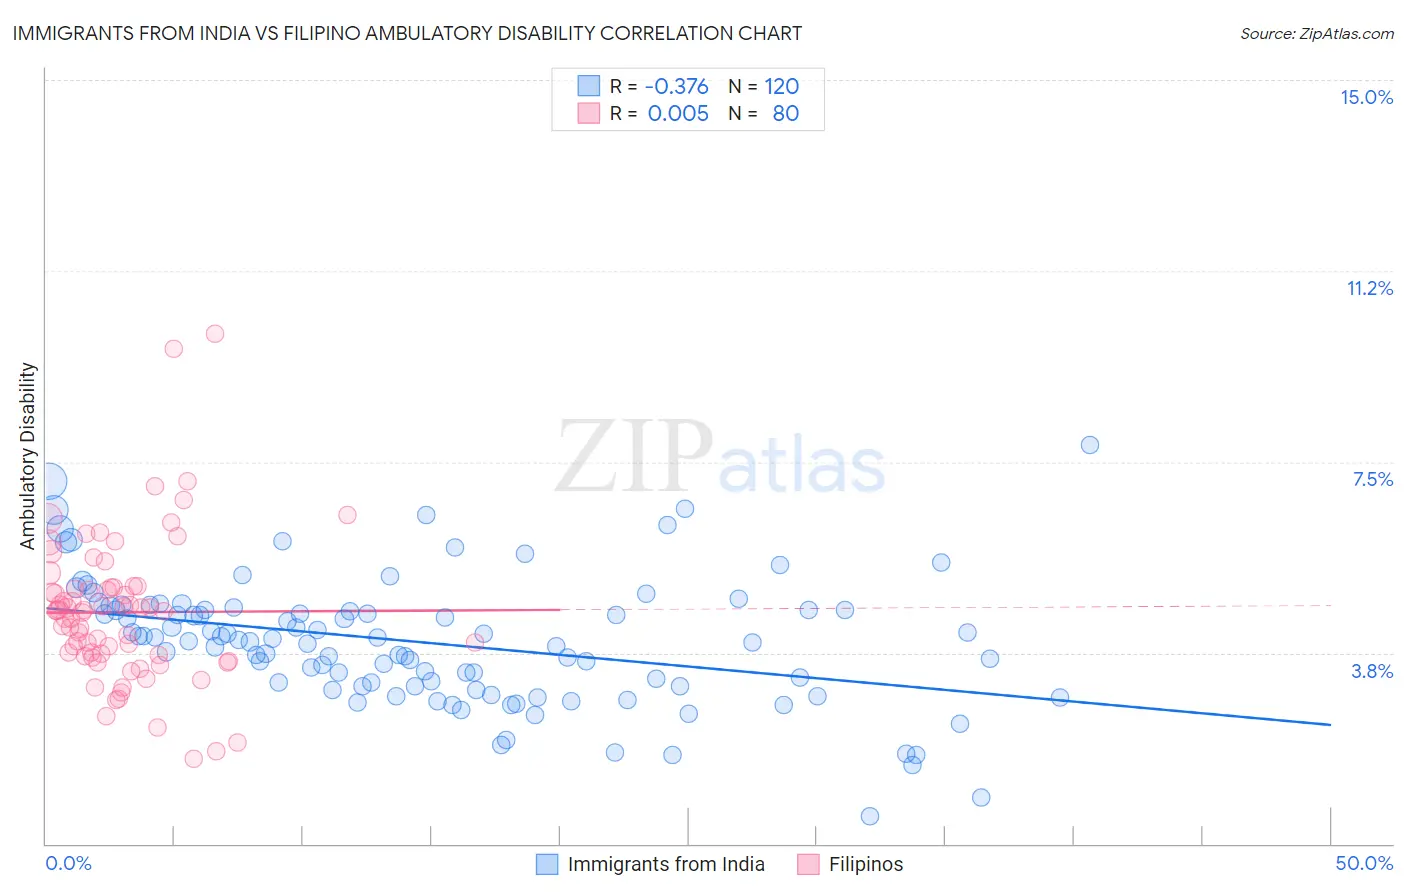
Immigrants from India vs Filipino Ambulatory Disability Correlation Chart
The statistical analysis conducted on geographies consisting of 433,949,483 people shows a mild negative correlation between the proportion of Immigrants from India and percentage of population with ambulatory disability in the United States with a correlation coefficient (R) of -0.376 and weighted average of 4.8%. Similarly, the statistical analysis conducted on geographies consisting of 254,292,295 people shows no correlation between the proportion of Filipinos and percentage of population with ambulatory disability in the United States with a correlation coefficient (R) of 0.005 and weighted average of 4.9%, a difference of 2.0%.
Ambulatory Disability Correlation Summary
| Measurement | Immigrants from India | Filipino |
| Minimum | 0.54% | 1.7% |
| Maximum | 7.8% | 10.0% |
| Range | 7.3% | 8.3% |
| Mean | 4.0% | 4.5% |
| Median | 4.0% | 4.6% |
| Interquartile 25% (IQ1) | 3.1% | 3.7% |
| Interquartile 75% (IQ3) | 4.6% | 5.0% |
| Interquartile Range (IQR) | 1.5% | 1.3% |
| Standard Deviation (Sample) | 1.3% | 1.4% |
| Standard Deviation (Population) | 1.2% | 1.4% |
Demographics Similar to Immigrants from India and Filipinos by Ambulatory Disability
In terms of ambulatory disability, the demographic groups most similar to Immigrants from India are Thai (4.9%, a difference of 3.2%), Immigrants from Taiwan (4.9%, a difference of 3.5%), Immigrants from Singapore (5.0%, a difference of 4.9%), Immigrants from Bolivia (5.0%, a difference of 5.7%), and Bolivian (5.1%, a difference of 6.0%). Similarly, the demographic groups most similar to Filipinos are Thai (4.9%, a difference of 1.2%), Immigrants from Taiwan (4.9%, a difference of 1.4%), Immigrants from Singapore (5.0%, a difference of 2.8%), Immigrants from Bolivia (5.0%, a difference of 3.5%), and Bolivian (5.1%, a difference of 3.9%).
| Demographics | Rating | Rank | Ambulatory Disability |
| Immigrants | India | 100.0 /100 | #1 | Exceptional 4.8% |
| Filipinos | 100.0 /100 | #2 | Exceptional 4.9% |
| Thais | 100.0 /100 | #3 | Exceptional 4.9% |
| Immigrants | Taiwan | 100.0 /100 | #4 | Exceptional 4.9% |
| Immigrants | Singapore | 100.0 /100 | #5 | Exceptional 5.0% |
| Immigrants | Bolivia | 100.0 /100 | #6 | Exceptional 5.0% |
| Bolivians | 100.0 /100 | #7 | Exceptional 5.1% |
| Immigrants | South Central Asia | 100.0 /100 | #8 | Exceptional 5.1% |
| Iranians | 100.0 /100 | #9 | Exceptional 5.1% |
| Yup'ik | 100.0 /100 | #10 | Exceptional 5.2% |
| Immigrants | Korea | 100.0 /100 | #11 | Exceptional 5.2% |
| Okinawans | 100.0 /100 | #12 | Exceptional 5.3% |
| Burmese | 100.0 /100 | #13 | Exceptional 5.3% |
| Immigrants | Eastern Asia | 100.0 /100 | #14 | Exceptional 5.3% |
| Immigrants | China | 100.0 /100 | #15 | Exceptional 5.3% |
| Immigrants | Hong Kong | 100.0 /100 | #16 | Exceptional 5.3% |
| Immigrants | Ethiopia | 100.0 /100 | #17 | Exceptional 5.4% |
| Immigrants | Sri Lanka | 100.0 /100 | #18 | Exceptional 5.4% |
| Indians (Asian) | 100.0 /100 | #19 | Exceptional 5.4% |
| Ethiopians | 100.0 /100 | #20 | Exceptional 5.4% |