Immigrants from India vs Puerto Rican 4th Grade
COMPARE
Immigrants from India
Puerto Rican
4th Grade
4th Grade Comparison
Immigrants from India
Puerto Ricans
98.0%
4TH GRADE
99.1/ 100
METRIC RATING
81st/ 347
METRIC RANK
96.7%
4TH GRADE
0.0/ 100
METRIC RATING
293rd/ 347
METRIC RANK
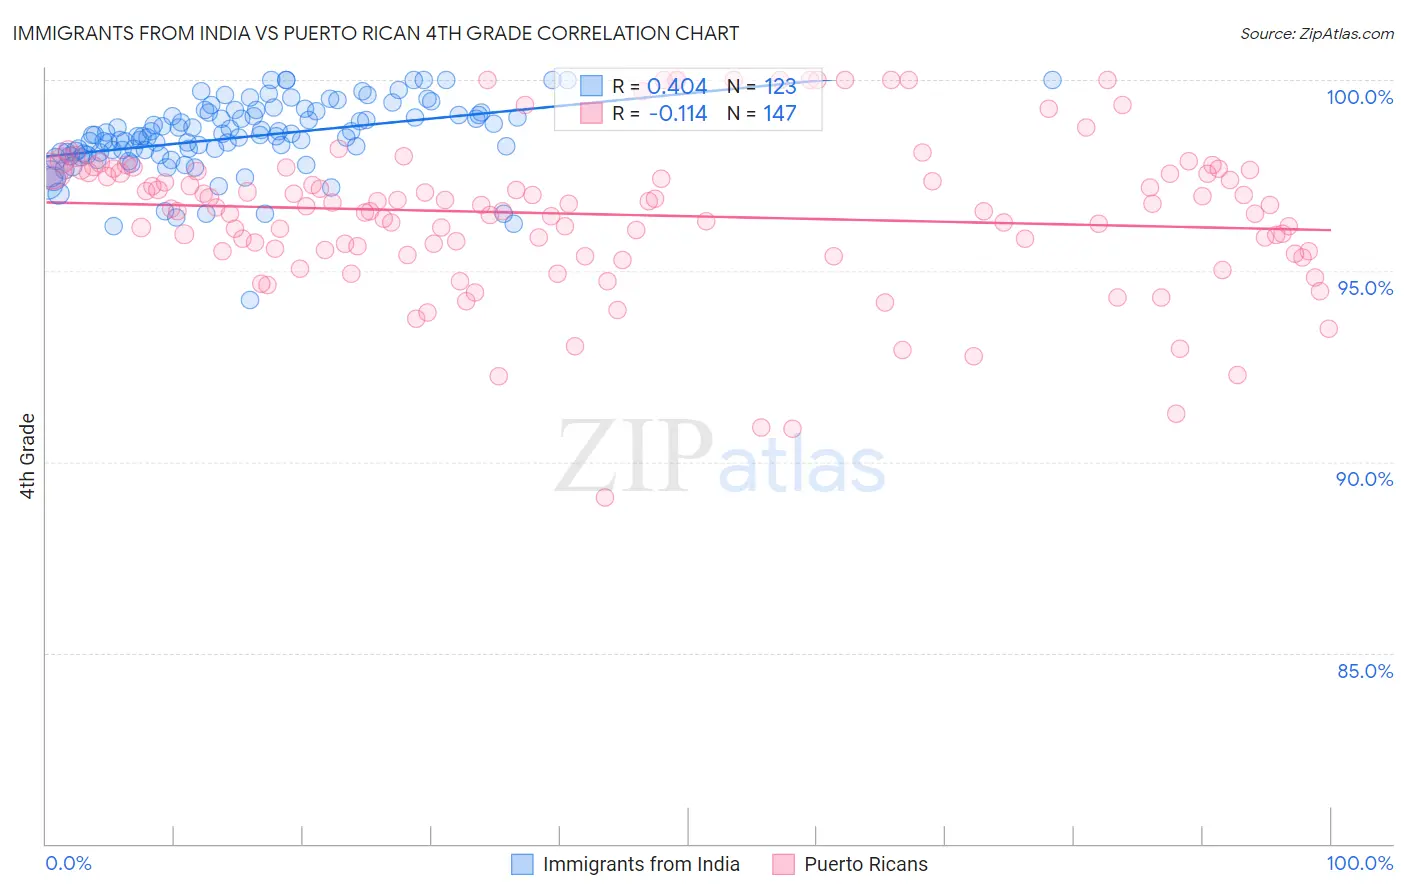
Immigrants from India vs Puerto Rican 4th Grade Correlation Chart
The statistical analysis conducted on geographies consisting of 434,105,844 people shows a moderate positive correlation between the proportion of Immigrants from India and percentage of population with at least 4th grade education in the United States with a correlation coefficient (R) of 0.404 and weighted average of 98.0%. Similarly, the statistical analysis conducted on geographies consisting of 528,320,438 people shows a poor negative correlation between the proportion of Puerto Ricans and percentage of population with at least 4th grade education in the United States with a correlation coefficient (R) of -0.114 and weighted average of 96.7%, a difference of 1.3%.
4th Grade Correlation Summary
| Measurement | Immigrants from India | Puerto Rican |
| Minimum | 94.2% | 89.1% |
| Maximum | 100.0% | 100.0% |
| Range | 5.8% | 10.9% |
| Mean | 98.5% | 96.5% |
| Median | 98.5% | 96.7% |
| Interquartile 25% (IQ1) | 98.1% | 95.5% |
| Interquartile 75% (IQ3) | 99.2% | 97.6% |
| Interquartile Range (IQR) | 1.1% | 2.1% |
| Standard Deviation (Sample) | 0.96% | 2.0% |
| Standard Deviation (Population) | 0.95% | 2.0% |
Similar Demographics by 4th Grade
Demographics Similar to Immigrants from India by 4th Grade
In terms of 4th grade, the demographic groups most similar to Immigrants from India are Icelander (98.0%, a difference of 0.0%), Ukrainian (98.0%, a difference of 0.010%), Osage (98.0%, a difference of 0.010%), Immigrants from Netherlands (98.0%, a difference of 0.020%), and Cherokee (98.0%, a difference of 0.020%).
| Demographics | Rating | Rank | 4th Grade |
| Chickasaw | 99.4 /100 | #74 | Exceptional 98.0% |
| Immigrants | Netherlands | 99.3 /100 | #75 | Exceptional 98.0% |
| Cherokee | 99.3 /100 | #76 | Exceptional 98.0% |
| Immigrants | Lithuania | 99.3 /100 | #77 | Exceptional 98.0% |
| Immigrants | England | 99.3 /100 | #78 | Exceptional 98.0% |
| Ukrainians | 99.2 /100 | #79 | Exceptional 98.0% |
| Osage | 99.2 /100 | #80 | Exceptional 98.0% |
| Immigrants | India | 99.1 /100 | #81 | Exceptional 98.0% |
| Icelanders | 99.1 /100 | #82 | Exceptional 98.0% |
| Immigrants | Belgium | 99.0 /100 | #83 | Exceptional 97.9% |
| Cypriots | 98.9 /100 | #84 | Exceptional 97.9% |
| Potawatomi | 98.9 /100 | #85 | Exceptional 97.9% |
| Immigrants | Australia | 98.8 /100 | #86 | Exceptional 97.9% |
| Zimbabweans | 98.8 /100 | #87 | Exceptional 97.9% |
| Immigrants | South Africa | 98.8 /100 | #88 | Exceptional 97.9% |
Demographics Similar to Puerto Ricans by 4th Grade
In terms of 4th grade, the demographic groups most similar to Puerto Ricans are Malaysian (96.7%, a difference of 0.020%), Immigrants from Eritrea (96.7%, a difference of 0.020%), Immigrants from Grenada (96.7%, a difference of 0.030%), Immigrants from Portugal (96.6%, a difference of 0.040%), and British West Indian (96.7%, a difference of 0.050%).
| Demographics | Rating | Rank | 4th Grade |
| Immigrants | Thailand | 0.0 /100 | #286 | Tragic 96.8% |
| Houma | 0.0 /100 | #287 | Tragic 96.8% |
| Immigrants | Afghanistan | 0.0 /100 | #288 | Tragic 96.8% |
| Immigrants | West Indies | 0.0 /100 | #289 | Tragic 96.7% |
| British West Indians | 0.0 /100 | #290 | Tragic 96.7% |
| Immigrants | Grenada | 0.0 /100 | #291 | Tragic 96.7% |
| Malaysians | 0.0 /100 | #292 | Tragic 96.7% |
| Puerto Ricans | 0.0 /100 | #293 | Tragic 96.7% |
| Immigrants | Eritrea | 0.0 /100 | #294 | Tragic 96.7% |
| Immigrants | Portugal | 0.0 /100 | #295 | Tragic 96.6% |
| Somalis | 0.0 /100 | #296 | Tragic 96.6% |
| Immigrants | Somalia | 0.0 /100 | #297 | Tragic 96.5% |
| Haitians | 0.0 /100 | #298 | Tragic 96.5% |
| Immigrants | Dominica | 0.0 /100 | #299 | Tragic 96.5% |
| Immigrants | South Eastern Asia | 0.0 /100 | #300 | Tragic 96.5% |