Immigrants from Hungary vs Pima Self-Care Disability
COMPARE
Immigrants from Hungary
Pima
Self-Care Disability
Self-Care Disability Comparison
Immigrants from Hungary
Pima
2.4%
SELF-CARE DISABILITY
89.6/ 100
METRIC RATING
128th/ 347
METRIC RANK
2.8%
SELF-CARE DISABILITY
0.0/ 100
METRIC RATING
301st/ 347
METRIC RANK
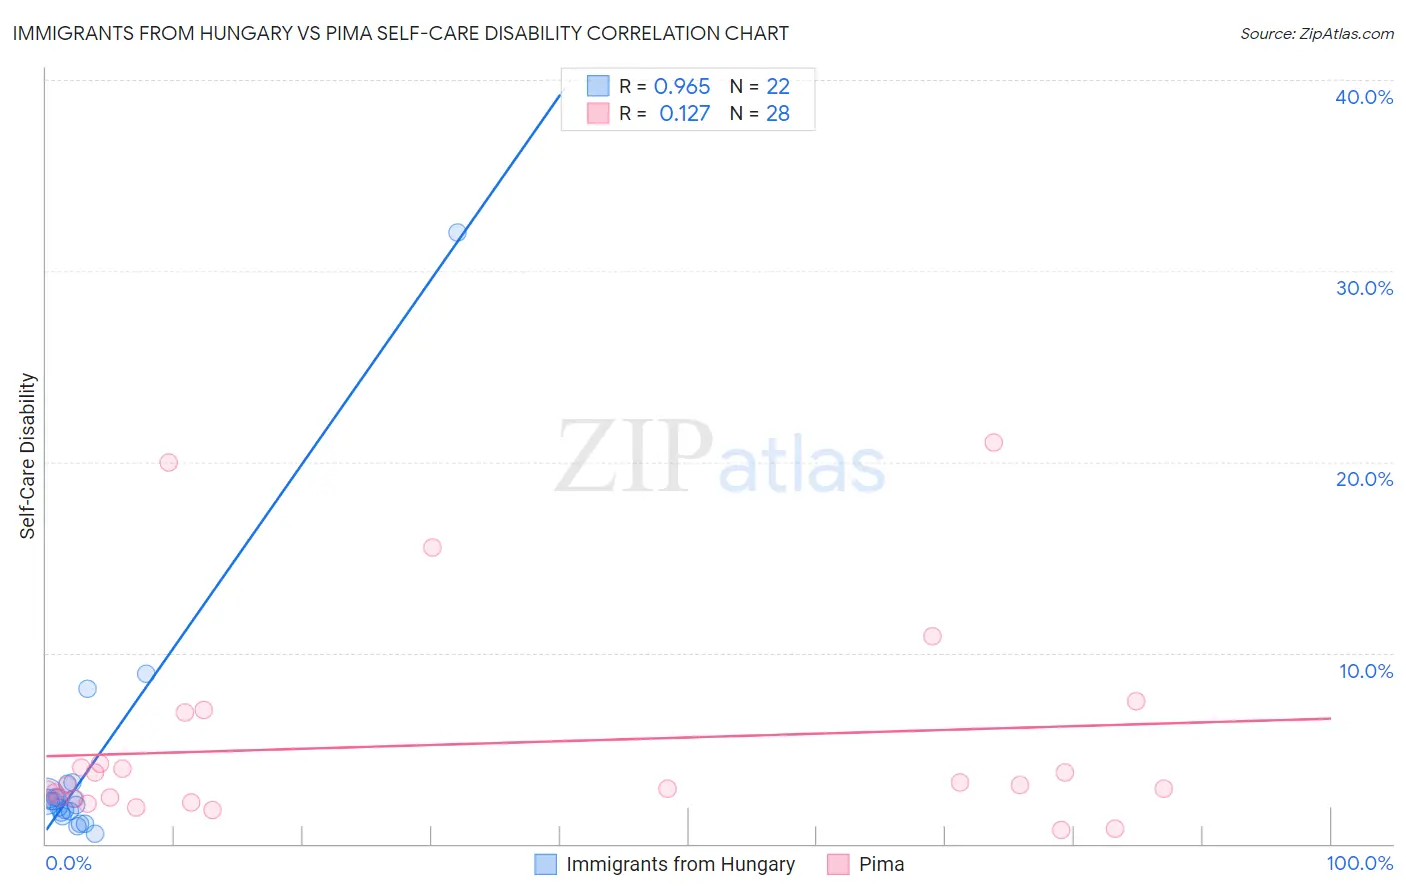
Immigrants from Hungary vs Pima Self-Care Disability Correlation Chart
The statistical analysis conducted on geographies consisting of 195,644,142 people shows a perfect positive correlation between the proportion of Immigrants from Hungary and percentage of population with self-care disability in the United States with a correlation coefficient (R) of 0.965 and weighted average of 2.4%. Similarly, the statistical analysis conducted on geographies consisting of 61,528,546 people shows a poor positive correlation between the proportion of Pima and percentage of population with self-care disability in the United States with a correlation coefficient (R) of 0.127 and weighted average of 2.8%, a difference of 15.7%.
Self-Care Disability Correlation Summary
| Measurement | Immigrants from Hungary | Pima |
| Minimum | 0.51% | 0.75% |
| Maximum | 32.0% | 21.0% |
| Range | 31.5% | 20.3% |
| Mean | 3.9% | 5.2% |
| Median | 2.2% | 3.1% |
| Interquartile 25% (IQ1) | 1.7% | 2.4% |
| Interquartile 75% (IQ3) | 2.5% | 5.5% |
| Interquartile Range (IQR) | 0.80% | 3.1% |
| Standard Deviation (Sample) | 6.6% | 5.3% |
| Standard Deviation (Population) | 6.4% | 5.2% |
Similar Demographics by Self-Care Disability
Demographics Similar to Immigrants from Hungary by Self-Care Disability
In terms of self-care disability, the demographic groups most similar to Immigrants from Hungary are Colombian (2.4%, a difference of 0.010%), Hmong (2.4%, a difference of 0.040%), Immigrants from Romania (2.4%, a difference of 0.050%), Immigrants from Morocco (2.4%, a difference of 0.080%), and Immigrants from North America (2.4%, a difference of 0.080%).
| Demographics | Rating | Rank | Self-Care Disability |
| Peruvians | 91.3 /100 | #121 | Exceptional 2.4% |
| Belgians | 90.9 /100 | #122 | Exceptional 2.4% |
| Immigrants | Nigeria | 90.3 /100 | #123 | Exceptional 2.4% |
| Immigrants | Morocco | 90.2 /100 | #124 | Exceptional 2.4% |
| Immigrants | North America | 90.2 /100 | #124 | Exceptional 2.4% |
| Hmong | 89.9 /100 | #126 | Excellent 2.4% |
| Colombians | 89.7 /100 | #127 | Excellent 2.4% |
| Immigrants | Hungary | 89.6 /100 | #128 | Excellent 2.4% |
| Immigrants | Romania | 89.3 /100 | #129 | Excellent 2.4% |
| Immigrants | Austria | 89.0 /100 | #130 | Excellent 2.4% |
| Poles | 88.9 /100 | #131 | Excellent 2.4% |
| Immigrants | South America | 88.8 /100 | #132 | Excellent 2.4% |
| Immigrants | Colombia | 88.5 /100 | #133 | Excellent 2.4% |
| Russians | 88.2 /100 | #134 | Excellent 2.4% |
| Laotians | 87.8 /100 | #135 | Excellent 2.4% |
Demographics Similar to Pima by Self-Care Disability
In terms of self-care disability, the demographic groups most similar to Pima are Immigrants from St. Vincent and the Grenadines (2.8%, a difference of 0.040%), Immigrants from Fiji (2.8%, a difference of 0.090%), Immigrants from Belize (2.8%, a difference of 0.18%), Cree (2.8%, a difference of 0.34%), and Immigrants from West Indies (2.8%, a difference of 0.39%).
| Demographics | Rating | Rank | Self-Care Disability |
| Blackfeet | 0.0 /100 | #294 | Tragic 2.7% |
| Barbadians | 0.0 /100 | #295 | Tragic 2.7% |
| Immigrants | Portugal | 0.0 /100 | #296 | Tragic 2.8% |
| West Indians | 0.0 /100 | #297 | Tragic 2.8% |
| Americans | 0.0 /100 | #298 | Tragic 2.8% |
| Immigrants | Guyana | 0.0 /100 | #299 | Tragic 2.8% |
| Immigrants | Fiji | 0.0 /100 | #300 | Tragic 2.8% |
| Pima | 0.0 /100 | #301 | Tragic 2.8% |
| Immigrants | St. Vincent and the Grenadines | 0.0 /100 | #302 | Tragic 2.8% |
| Immigrants | Belize | 0.0 /100 | #303 | Tragic 2.8% |
| Cree | 0.0 /100 | #304 | Tragic 2.8% |
| Immigrants | West Indies | 0.0 /100 | #305 | Tragic 2.8% |
| Aleuts | 0.0 /100 | #306 | Tragic 2.8% |
| Natives/Alaskans | 0.0 /100 | #307 | Tragic 2.8% |
| Immigrants | Grenada | 0.0 /100 | #308 | Tragic 2.8% |