Immigrants from Hungary vs Belizean Child Poverty Under the Age of 16
COMPARE
Immigrants from Hungary
Belizean
Child Poverty Under the Age of 16
Child Poverty Under the Age of 16 Comparison
Immigrants from Hungary
Belizeans
15.5%
CHILD POVERTY UNDER THE AGE OF 16
81.9/ 100
METRIC RATING
144th/ 347
METRIC RANK
19.9%
CHILD POVERTY UNDER THE AGE OF 16
0.1/ 100
METRIC RATING
276th/ 347
METRIC RANK
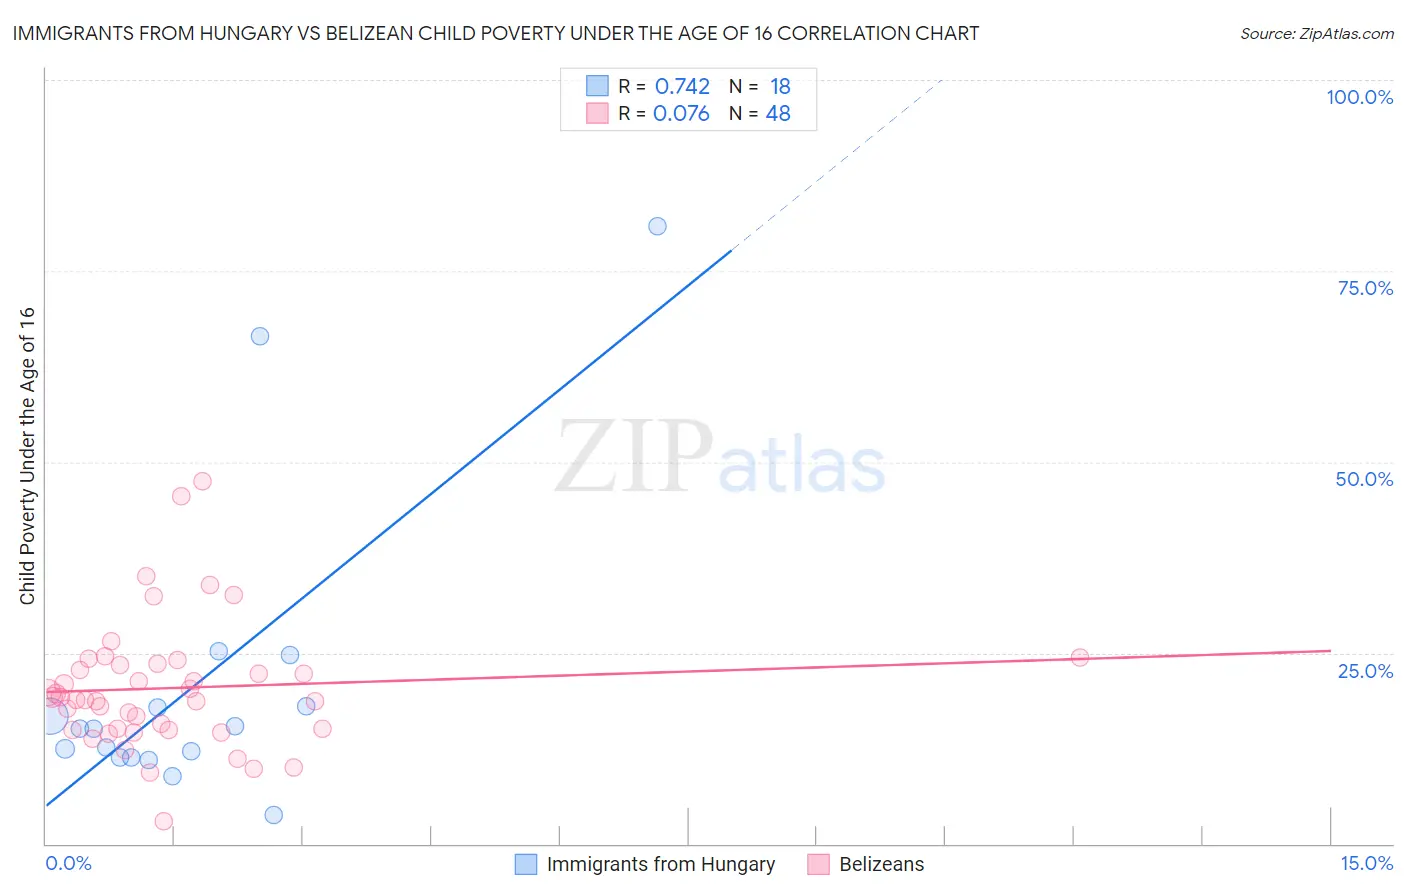
Immigrants from Hungary vs Belizean Child Poverty Under the Age of 16 Correlation Chart
The statistical analysis conducted on geographies consisting of 194,708,253 people shows a strong positive correlation between the proportion of Immigrants from Hungary and poverty level among children under the age of 16 in the United States with a correlation coefficient (R) of 0.742 and weighted average of 15.5%. Similarly, the statistical analysis conducted on geographies consisting of 143,921,177 people shows a slight positive correlation between the proportion of Belizeans and poverty level among children under the age of 16 in the United States with a correlation coefficient (R) of 0.076 and weighted average of 19.9%, a difference of 28.3%.
Child Poverty Under the Age of 16 Correlation Summary
| Measurement | Immigrants from Hungary | Belizean |
| Minimum | 3.7% | 2.9% |
| Maximum | 80.8% | 47.5% |
| Range | 77.1% | 44.7% |
| Mean | 21.0% | 20.4% |
| Median | 15.0% | 19.0% |
| Interquartile 25% (IQ1) | 11.4% | 15.0% |
| Interquartile 75% (IQ3) | 17.9% | 23.5% |
| Interquartile Range (IQR) | 6.6% | 8.6% |
| Standard Deviation (Sample) | 20.0% | 8.4% |
| Standard Deviation (Population) | 19.4% | 8.3% |
Similar Demographics by Child Poverty Under the Age of 16
Demographics Similar to Immigrants from Hungary by Child Poverty Under the Age of 16
In terms of child poverty under the age of 16, the demographic groups most similar to Immigrants from Hungary are Immigrants from Peru (15.5%, a difference of 0.050%), Slovak (15.5%, a difference of 0.10%), Icelander (15.4%, a difference of 0.12%), Brazilian (15.4%, a difference of 0.19%), and Immigrants from Kuwait (15.5%, a difference of 0.29%).
| Demographics | Rating | Rank | Child Poverty Under the Age of 16 |
| Peruvians | 87.2 /100 | #137 | Excellent 15.3% |
| Welsh | 87.2 /100 | #138 | Excellent 15.3% |
| Immigrants | Vietnam | 87.1 /100 | #139 | Excellent 15.3% |
| New Zealanders | 86.9 /100 | #140 | Excellent 15.3% |
| Slavs | 84.2 /100 | #141 | Excellent 15.4% |
| Brazilians | 82.8 /100 | #142 | Excellent 15.4% |
| Icelanders | 82.5 /100 | #143 | Excellent 15.4% |
| Immigrants | Hungary | 81.9 /100 | #144 | Excellent 15.5% |
| Immigrants | Peru | 81.7 /100 | #145 | Excellent 15.5% |
| Slovaks | 81.4 /100 | #146 | Excellent 15.5% |
| Immigrants | Kuwait | 80.5 /100 | #147 | Excellent 15.5% |
| Puget Sound Salish | 80.3 /100 | #148 | Excellent 15.5% |
| Israelis | 80.1 /100 | #149 | Excellent 15.5% |
| Immigrants | Jordan | 78.5 /100 | #150 | Good 15.6% |
| French | 78.5 /100 | #151 | Good 15.6% |
Demographics Similar to Belizeans by Child Poverty Under the Age of 16
In terms of child poverty under the age of 16, the demographic groups most similar to Belizeans are Immigrants from Cabo Verde (19.9%, a difference of 0.0%), Immigrants from Barbados (19.9%, a difference of 0.0%), Iroquois (19.9%, a difference of 0.14%), Immigrants from Jamaica (19.8%, a difference of 0.16%), and Bangladeshi (19.9%, a difference of 0.24%).
| Demographics | Rating | Rank | Child Poverty Under the Age of 16 |
| Immigrants | El Salvador | 0.1 /100 | #269 | Tragic 19.7% |
| Spanish American Indians | 0.1 /100 | #270 | Tragic 19.7% |
| Immigrants | Liberia | 0.1 /100 | #271 | Tragic 19.7% |
| Immigrants | Bangladesh | 0.1 /100 | #272 | Tragic 19.8% |
| Immigrants | Jamaica | 0.1 /100 | #273 | Tragic 19.8% |
| Immigrants | Cabo Verde | 0.1 /100 | #274 | Tragic 19.9% |
| Immigrants | Barbados | 0.1 /100 | #275 | Tragic 19.9% |
| Belizeans | 0.1 /100 | #276 | Tragic 19.9% |
| Iroquois | 0.1 /100 | #277 | Tragic 19.9% |
| Bangladeshis | 0.0 /100 | #278 | Tragic 19.9% |
| Sub-Saharan Africans | 0.0 /100 | #279 | Tragic 19.9% |
| Comanche | 0.0 /100 | #280 | Tragic 19.9% |
| Central Americans | 0.0 /100 | #281 | Tragic 20.0% |
| Barbadians | 0.0 /100 | #282 | Tragic 20.0% |
| Immigrants | Zaire | 0.0 /100 | #283 | Tragic 20.1% |